SQL Azure Data Sync is another such service on the Azure platform that can be seen as a HADR provider for cloud. Ofcourse data centers take care of the disaster recovery part of the data stored on cloud, but in situations where data is exchanged in-premise and off-premise across data consumers, data sync can play a very active role in the high availability part of the data stored on cloud.
Monday, January 31, 2011
SQL Server AlwaysOn and SQL Azure Data Sync for HADR
I'm reading: SQL Server AlwaysOn and SQL Azure Data Sync for HADRTweet this !SQL Azure Data Sync is another such service on the Azure platform that can be seen as a HADR provider for cloud. Ofcourse data centers take care of the disaster recovery part of the data stored on cloud, but in situations where data is exchanged in-premise and off-premise across data consumers, data sync can play a very active role in the high availability part of the data stored on cloud.
Thursday, January 27, 2011
Azure Books - Windows Azure Book and SQL Azure Book : Review
I'm reading: Azure Books - Windows Azure Book and SQL Azure Book : ReviewTweet this !Update:
I have been very late in sharing the review as my new job keeps me quite busy, so I have not been able to spend time on this item. Below is the review of the book "Microsoft Azure: Enterprise Application Development".
This book is almost of the same flavor as the SQL Azure book. Each chapter explain a different topic followed by a working example with step-by-step explanation. Certain topics like Web role, Worker role, Monitoring and Analytics, Table & Blob storage etc are very important topics from a Windows Azure perspective and those are reasonably well covered. I would have liked more depth in these chapters, but the chapter provides more references for curious minds who wish to dig more deeper in any particular topic. All-in-all I feel that this is the best start-up handbook for professionals who are fresh to Windows Azure environment and intend to come up to speed on Windows Azure environment.
Tuesday, January 25, 2011
MS BI Appliance Solution - HP Business Decision Appliance
I'm reading: MS BI Appliance Solution - HP Business Decision ApplianceTweet this !Monday, January 24, 2011
I joined Accenture
I'm reading: I joined AccentureTweet this !Thursday, January 20, 2011
Selecting the best Business Intelligence software / service provider for your BI needs
I'm reading: Selecting the best Business Intelligence software / service provider for your BI needsTweet this !Tuesday, January 18, 2011
Self Service Dashboard Development using Analyzer as Reporting Solution
I'm reading: Self Service Dashboard Development using Analyzer as Reporting SolutionTweet this !Self-service BI
Self-service BI is a buzzword and sales folks generally use it as one of their Unique Selling Propositions (USPs) to market their solutions. In my view there is a difference between self-service BI and managed self-service BI. Easy authoring and controlled utilization are two of the very important factors for a self-service BI solution. If the authoring environment is not easily adaptable, there is a great chance that your solution would not get utilized at all. If utilization is not controlled there would be an explosive and unorganized utilization, as the report users would treat the reporting solution as a lab to experiment with reports in a free-flow manner. In simple language, considering a reporting solution like Analyzer, the report authoring environment should be easy enough such that business users can create their dashboards with ease. Also user and role based security should be available, so that report authoring and utilization can be managed. In this article, I intend to share the report authoring experience.
Before one makes a decision about using a product, any CEO / CIO / SVP / Analyst would want to check out certain fundamental level details about the product, which generally falls into two categories: Capital Expenditure (CAPEX) and Operational Expenditure (OPEX). Let's glide through such details in brief.
Licensing (CAPEX): Analyzer comes in different licensing flavors, and the major classifications are:
OEM - Use this edition if you intend to integrate Analyzer into your own application by using the features of this solution as a web service.
SaaS - In cases where you intend to exploit the benefits of offering a reporting solution on your own cloud based platform, give a try to this edition.This version is used by companies who are hosting BI in their own cloud and (usually) charging their customers for access to a set of pre-built reports and dashboards and the data they contain, along with the ability to interact with that data.
Deployment (OPEX): Analyzer is a zero-footprint installation. This is generally a confused term with many professionals, so I would elaborate on this a bit. Analyzer can be installed on a central BI / DB server which has IIS installed on it. Or the IIS machine can be a separate machine from the BI / DB server. Analyzer needs to be installed on an IIS server (one or more) as this solution is developed using .NET and DHTML, and it also needs access to a SQL Server 2005 / 2008 / R2 database engine as it creates a database to use for its internal functioning such as metadata storage. Workstations can connect to Analyzer using just a browser which means that you do not need to install anything on client machines except a browser. This is true no matter what role the user has, such as Admin, Report Designer, or End User.
Now let's focus on the beginner level recipe to create a dashboard using Analyzer. I call this recipe as "Zero to Dashboard in 60 Minutes".
Scenario: A Sales head of a company needs to create a quick last minute dashboard to present at the quarterly board meeting. Company has a cube that is created using SSAS, and for the sake of this demo we would be using the cube created using AdventureWorks SSAS project that ships with SQL Server.
Hardware Setup: Most companies have contracts with hardware maintenance vendors, and in such environment end-user terminals are equipped with only the necessary amount of hardware required as contracts can be pay-per-use. I intentionally used a machine with 1 GB RAM, 60 GB free hard disk space, and 1.77 GHz Intel processor. This is a typical configuration of any low end laptop that should be sufficient to folks who just need to use MS Office and Outlook on their machines.
Requirements: The target audience of the dashboard is the senior management of an organization, and the Sales Head is authoring the report. Such dashboard / report can be expected to contain a few of the commonly used constituents of a dashboard.
1) A ScoreCard containing KPIs, which can be hosted in the cube
2) Strategy Map showing at least some basic kind of process flow
3) Geospatial Reporting, which is one of the best presentation forms for a senior level business audience
4) Matrix Reporting, for a detailed level study of aggregated figures
5) Filters, which are necessary to analyze the details in isolated scopes
6) Drill-Down functionality, as problems decomposition and study is carried out in a hierarchical manner.
Report Authoring: I had Analyzer and the AdventureWorks cube on the same machine. Once you start Analyzer and create a new report, you would find the interface as visible in the below screenshot. To author the report, entire functionality is available on the toolbar or from context-sensitive menus. Plotting data on controls is a matter of drag-and-drop from the data tab visible on the left side.
1) KPI Viewer - This control be used for creating a scorecard hosting KPIs. Also you would find some very interesting columns like "Importance" out-of-box which can be quite an effort to create in PerformancePoint Services.
2) Process Diagram - This control can be used to create a basic level strategy map. Though this strategy map is not as appealing as a Strategy Map created out of a data-driven diagram in Visio, but still its fine enough for a last minute dashboard. Also it can host my KPIs there too.
3) Intelligent Map - This can be considered synonymous to what Bing Maps control is to SSRS. It's completely configurable and contains wide variety of maps ranging from World Map to area-specific maps.
4) Pivot Table - This control is perfectly suitable for OLAP reporting in a grid based UI.
5) Filters - Report filter have a very different UI, than traditional UI of a drop-down. Though it occupies more real-estate of screen space, it makes the report more appealing, so it's worth it. Considering the present scope of this report, I chose to place the filters at the bottom of the page, instead of placing it at the top.
You can see at the bottom of these screenshots that each report or dashboard in Analyzer can contain multiple sheets (no limit) each of which can contain its own combination of controls such as pivot tables, maps, charts, etc. In this example we are only using one sheet.
Check out the context menus of all these different controls, and you can see what different options are available with each control. On selecting "Discover Children" at "Alabama" level in pivot table, a different sheet opens up with this wonderful report and UI, as shown in the below screenshot.
Summary: With out-of-the-box controls, drag-and-drop functionality, a very decent looking report can be created in less than 60 minutes, to target the senior most audience of an organization who expect a report that supports decision making with its analytical capabilities. Provided your cube is ready with all the data structures like KPIs, Named Sets, Hierarchies, Measures, etc., reporting is almost taken care of if Analyzer is available at your disposal. A phrase that suits the summary is "Keep your ducks in a row" i.e. have your cube in proper shape to support your reporting, and then using Analyzer, below is the result that I was able to achieve in less than an hour, with very little experience using Analyzer beforehand. A more experienced Analyzer user could no doubt build this kind of report even faster.
Monday, January 17, 2011
SSIS and StreamInsight Integration
I'm reading: SSIS and StreamInsight IntegrationTweet this !SSIS is gradually evolving as a rich platform that can facilitate much more than the very definition of what we term as ETL.
1) Script Transform is the first window connecting SSIS to the managed .NET / unmanaged COM world. We already have established examples where we can use this transform to use services like Bing Maps, SSRS and others.
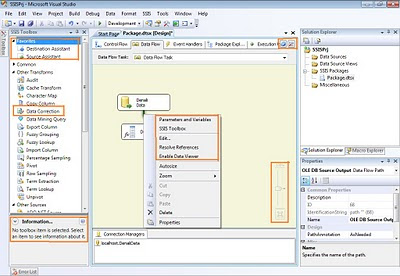
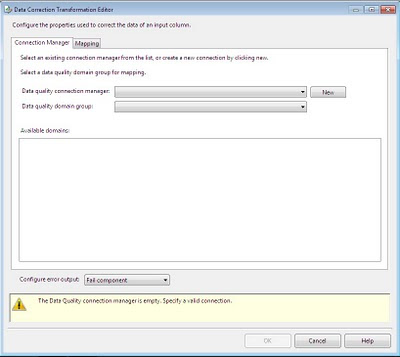
2) Data Correction transform is another upcoming transform that connects SSIS to SSDQS in SQL Server Denali. Considering this transform coupled with Data Profiler Task and Data Profile Viewer, SSIS has sufficient ammunition to target corporate data cleansing assignments.
3) The transform that I discussed above "StreamInsight Multi Stream Transform" is a transform that has been developed in a POC carried out by SQL CAT Team. Entire explanation of to and fro integration of SSIS and StreamInsight has been wrapped up in a whitepaper, which can be read from here. This whitepaper is under the umbrella of SQL Server 2008 R2, but one of the screenshots which shows SSIS implementation has the icons of SSIS that are only available in SSIS Denali CTP1, which means that it might have been tested in SSIS Denali. So my forensic sense tells me that, it should be very well possible in SSIS Denali too, and logically speaking it should.
Sunday, January 16, 2011
Contained Databases in SQL Server Denali
I'm reading: Contained Databases in SQL Server DenaliTweet this !Friday, January 14, 2011
Farewell to Capgemini
I'm reading: Farewell to CapgeminiTweet this !Tuesday, January 11, 2011
SSIS Denali CTP1 Designer Enhacements and Improvements
I'm reading: SSIS Denali CTP1 Designer Enhacements and ImprovementsTweet this !Some of the features that I still miss are coloring of icons when they are configured using expressions, ability to specify data type in derived column transform by using editor itself without the need to change it from advanced editor and exporting package design to jpeg/pdf formats. As of now it looks that BIDS is here to stay, but it's too early to comment anything.
Monday, January 10, 2011
Data Quality Services and SSIS in SQL Server Denali
I'm reading: Data Quality Services and SSIS in SQL Server DenaliTweet this !Saturday, January 08, 2011
Book on SQL Azure - Reviewed by Siddharth Mehta
I'm reading: Book on SQL Azure - Reviewed by Siddharth MehtaTweet this !Thursday, January 06, 2011
SQLBI Methodology - Review
I'm reading: SQLBI Methodology - ReviewTweet this !Below are my views / feedback after analysing the architecture document. To better understand my views, please read the architecture document prior to reading the below points.
Size of BI solution Vs Complexity: In my views/experiecne, the volume of data that needs to be processed ( right from OLTP till it gets stored in MOLAP ) combined with the size of the BI solution sponsor is directly proportional to the adoption of BI solution develppment / adoption methodology.
In simple words, if SMBs can manage their BI solution development using a SaaS methodology compared to developing DW after buying software licenses, most would approach the former methodology. Those businesses who adopt the full refresh of DW every time, would not care much for a methodical approach as change management and incremental loads are not their concerns at all due to the short-lived historical state of DW. Organizations having a large DWs, often in units of TBs would definitely care for a methodical approach as the magnitude of impact of any change is quite huge.
Components of a BI Solution:
1) Source OLTP database - OLTP has known issues, which majorly affect delta detection and accessiblity of DB to DW development team. I completely agree on this part. Here a concept called "Mirror OLTP" is introduced.
If Mirror OLTP is used as a facade, it would not be of much sense as if you can create database objects in other database and then fire a cross-db query, then logically speaking the same facade should be allowed to be created in source OLTP with the isolation of a logical boundary like schemas.
If Mirror OLTP is considered as a snapshot, which is almost a clone of the original DB, one can exercise full control over the source DB, but this is not as easy to implement as it sounds. Consider that a source DB that lies on a SAN and is horizontally partitioned across geographies and you are trying to replicate the same. For this Mirror OLTP you would require to constanly maintain another DB, which demands an increases TCO of the solution. It would require a pass from information security policies and guidelines as audits like BS7799 / SOX etc would require strict compliance.
Instead of developing a Mirror OLTP, one option can be, creating a script of views / SPs / any database objects, and create them just-in-time (which would be also easy for approval from DBAs as they would be more happy for this temporary gateway opening than a permanent cross-db gateway), use them for delta detection and then purge out the same. These scripts can be deployed using VSTS 2010 / VSTS DB edition / any other change management tools you would have at your disposal.
In worst cases, where this option can't be worked, we can opt for what we call as Permanent Staging area, completely suide with data and metadata aligned towards facilitating ETL for DW loads. To me, Mirror OLTP seems to be a compound of the same.
2) Configuration DB - This seems like a facade opened up for users to configure the Mirror OLTP / Staging area / DW / Data Marts, with some built-in configuration settings / logic for each layer.
3) Staging area - This is identified as a temporary staging area. Here it's mentioned as one cannot store persistent data in staging, and I opt to differ from this theory. For managing master data from different source systems, which would not contain delta everytime but would still be required for ETL processing due to ER model design, a permanent staging area can exist. Temporary staging area is also required, and this section is completely alright with me.
4) Data warehouse and Data Marts - This details mentioned in this section seems almost Inmon methodology, where you develop a DB containing your consolidated data from ETL and then you build marts which can be thought of as a limited compound of DW DB. This can be thought as synonymous to what perspectives are to cubes. Data Marts are basically crafted here to compartmentalize different functional areas in DW. Here you would be required to create what I term as "Master Data Mart" and other data marts would be based on functional areas. Maintaining and populating these data marts can be quite challenging.
5) OLAP Cubes - You would create cubes containing data from one functional data mart + master data mart.
6) SSRS Reports - To me this deparment seems to be struggling, due to the design of data marts. Reporting requirements can be extremely volatile which can be complex enough to induce a change, which would require manipulating ETL -> DW -> Data Mart. Also there can be cases where you might introduce an another small ETL layer between DW -> Data Mart. Operational reporting would be done against Data Marts and not DW, as this architecture is an adoption of Inmon's view to a greater extent.
7) Client Tools - This section is okay with me.
8) Operational Data Store - This section clearly identifies that ODS should be used with care.
Summary: In my views, this architecture can be perceived to act like a Prism. You have a ray of light, and after passing through the prism, it splits out in different colors. And you can catch the color you need.
One big issue that I see with this architecture is Lineage Analysis. In this architecture lineage analysis becomes very very complex, as deriving lineage of data from a dashboard till OLTP is highly challenging. In addition to the configuration DB layer, there should be one more vertical layer where lineage of the data is tracked.
Considering a practical example, say you have a corporation that consists subsidiary companies, for ex CitiGroup has child companies like CitiCorp, CitiBank, CitiSecurities, CitiMortgage etc. When data is intended for CitiGroup level to CitiBank level, this architecture can hold good, as each child companies is a different business unit & model with it's own level of complexity. And each child company's analysis would have a dependency on data from other child companies to a certain level. This architecture seems effective at this stage.
If I were to implement this only at the CitiBank level, I would clearly go for Kimball methodology. But this is my understanding, analysis and choice. There are a lot of scenarios in the sea of business models and requirements, and I am sure this architecture with certain modifications (which is my personal preference), can help in a very effective manner.
Wednesday, January 05, 2011
Dashboards to monitor data warehouse development and execution
I'm reading: Dashboards to monitor data warehouse development and executionTweet this !Monday, January 03, 2011
Data warehouse development life-cycle
I'm reading: Data warehouse development life-cycleTweet this !Speaking from a high level, from a DW development perspective, firstly one needs to figure out the boundaries of development. Generally the extreme boundary starts from OLTP and ends at Dashboards. After having these boundaries considered, the following are the layers / development arenas one can consider for a DW development from scratch.
1) Delta Detection - This is the first exercise that you would plan with your OLTP system. This is a very important exercise, as this would decide a few other exercises in the life-cycle.
2) Staging Area - Based on the requirements and considering the complexity of delta detection, a temporary / permanent staging area development would be required.
3) Master Data Management - Do not confuse it with the standard MDM practice, which is more towards modeling. Here MDM means how you would manage your MDM in the staging area / in the delta, as delta applies only to transactional data. Master data do not change that often, and you need master data for your ETL processing. This has to be managed at the facade layer you would build for delta detection / in the staging area, but it has to be planned along with the points 1 and 2.
4) Dimensional Modeling - This is the exercise where you start modeling your dimensions using the Kimball / Inmon methodology.
5) Data Mart Design & Development - Only after the point 4, one can start developing a data mart which lays down the base for the next exercise of ETL development.
6) ETL Design & Development - Points 1 - 2 - 3 are to serve the ETL processing. ETL basically serves as the processing engine to transform your relational data to suit the model of your data mart. One can consider the above points in E and this is T + L. Until you Data Mart is in place, one does not have any idea about the target schema, so ETL development makes sense only at this level.