Wednesday, September 29, 2010

Tableau and BonaVista Dimensions for self service data analysis and diversified data visualizations

I'm reading: Tableau and BonaVista Dimensions for self service data analysis and diversified data visualizationsTweet this !
The term "self-service" has been making a strong buzz since quite some time. Though PPS caters the platform for dashboard creation and sharepoint hosts it very well, but still I feel that Microsoft has a lot of scope to improve in the data visualization area. Microsoft acquired the license from Dundas for charts and graphs, and the same can be seen being available in SSRS and Excel, with the addition of visualization enhancements like Sparklines, Indicators etc. But in my views, still it's at a considerable distance from the data visualization capabilities that few other tool offers. Proclarity had some of the best data visualization capabilities, and phase-by-phase same are being added to PPS. It was one of the best tools for data analysis and the visualizations that it created, especially the decomposition tree was spectacular.

Tableau is one of the leading tools in the area of data analysis for it's extremely rich data visualization capabilities, which makes analysis quite easy and appealing. One might immediately think that Excel has also got rich visualization capabilities as a client tool. Nothing can be rated without a comparison, and I suggest to go through this product tour video of tableau, to get a feel of the data visualization capabilities that it offers. Honestly speaking, I see it as one of the accelerator replacement, if you are not intending to invest into PPS and developer hours to build dashboards and want to equip your business analysts to self-serve data analysis. Also if you want to add the self-service effect with power packed data visualization capabilities, Tableau is one of the top 10 options to consider. Check out this amazing data visualization gallery.

BonaVista Systems, has launched a new product called BonaVista Dimensions. To me this product seems like another version of powerpivot. If you want to learn the rationale, based on what I am making this statement, check out this architecture diagram. In my views, what makes this product different from powerpivot, is the data visualization that it adds to Excel. It can be said that it adds tableau data visualization effect to Excel. I have not done any research into the pricing and licensing details, but what I can say by and large is that if you are looking to powerpack your data analysis using Excel as the client tool with Tableau class data visualizations, this product has the potential to add value to the data visualization and effectively the data analysis department.

One question that might come to one's mind is that why not Powerpivot? My immediate answer to the question would be that powerpivot still misses data visualization capabilities and whatever it offers in this area is on the shoulders of it's hosting tool i.e. Excel. I do not intend to say that these products are better replacements for powerpivot, each product has got it's own space. Till microsoft makes the quality of data visualization enriched to the level of Tableau, it can be seen as one of the best value additions on your MS BI solution, which again depends on factors like budget and time to market / time to delivery. In summary, excel is a good data analysis client tool to consume data from SSAS, but it can still be made a lot better.

Tuesday, September 28, 2010

Cross Join in SSIS and SSAS / MDX : Creating a cartesian product

I'm reading: Cross Join in SSIS and SSAS / MDX : Creating a cartesian productTweet this !
Recently Todd posted about Cross Join in SSIS, and he explained in great detail about how to do a cross join in SSIS, which can be read from here. It's important to understand the how part, but the "Why" part is also equally important in my views. If someone is able to answer how to do a cross join in SSIS, I would also like to know some real life scenarios where you would want to perform a cross-join using SSIS in a Data Flow. There are two real life scenarios where performing cross joins in SSIS would be beneficial, and of course, these are such scenarios where either you are not concerned about performance at all, or your intention is to test performance.

1) Populating Junk Dimensions: Junk dimensions are often formed with unrelated columns (i.e. attributes) in a single dimension table. Generally such tables contains very few records and can be easily populated using a script. But as a part of the policy, sometimes you may face situations where you need to populate Junk dimensions or even dimensions like "Date" using SSIS. In such situations you may find the need to use SSIS packages to populate such dimensions. Often such dimension populating is a one time process, and you would not use these packages often.

2) Performance testing SSIS packages: I personally feel that cross joining is a great way to generate huge test data with very less effort. Often when you need to test packages for performance or even other factors, the first thing that is required is test data. Say if I have 100 records in one data stream and 100 records in another data stream, by cross joining I can easily create 100 * 100 = 10000 records. This is some pretty quick test data !!

There can be many other scenarios, but these are the scenarios where I would use SSIS to create a cross join / Cartesian product, instead of using the database engine for the same purpose.

Cross Join is one such thing that is required in your MDX queries too. When you have two different hierarchies, for ex. say Products and Colors and you want to use it on the same axis i.e. you want a pivot kind of view where you want to see all products of all colors on the row axis / columns axis itself, you cannot achieve the same in MDX without cross joining these two different hierarchies on the same axis. This is one typical use where you would need to use Cross Join in SSAS / MDX.

In MDX, you can cross join different hierarchies by three different syntax or ways.

1) CrossJoin function: CrossJoin (Hierarchy1.level.Members , Hierarchy2.level.Members)

2) * operator: This is one of the shorthand for cross joining. Hierarchy1.level.Members * Hierarchy2.level.Members

3) () round brackets: To specify a set you would use curly braces {}. But if you intend to cross join, you can simply use the round brackets. (Hierarchy1.level.Members , Hierarchy2.level.Members).

Keep in view the I have included hierarchy.level.members for clarity. You can also just use hierarchy.level and that would bring all the members accordingly. In summary, in my views when you prepare for your interviews for questions like this, keep in mind that "why would you do something" is equally important to knowing "how would you do something".

Friday, September 24, 2010

Download Sample Dashboards from Visio 2010 Dashboard Gallery

I'm reading: Download Sample Dashboards from Visio 2010 Dashboard GalleryTweet this !
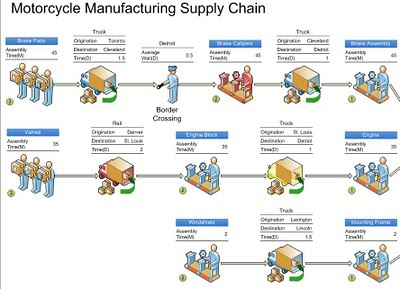
Dashboards are the face of a Business Intelligence solution to it's end users. Performancepoint is the key platform for dashboard development and the same are hosted on Sharepoint. I often mention this on my various posts, that Strategy Maps i.e. data driven visio diagrams are a very effective element of a dashboard constituency. Just check out the excerpt screenshot of a sample visio dashboard, and consider comparing it with a regular dashboard having just some grid and graphs. Recently one of my blog readers shared a Visio 2010 Dashboard Gallery link, which indeed is quite impressive. This gallery can be accessed from here.


Monday, September 20, 2010

MS BI Center of Excellence ( CoE ) : How to boost your technical growth via CoE

I'm reading: MS BI Center of Excellence ( CoE ) : How to boost your technical growth via CoETweet this !
I have been in charge in different capacities to manage MS BI CoE activities at different points in time. And this post is to share my views on MS BI CoE. As a part of competency building exercise, almost all of the CMM Level organizations have a CoE. The general impression among the developer community for a CoE remains that it's a POC (Proof Of Concept) Hub and a documentation office, using which managers want to shine their KPIs. Bluntly speaking, I would not disagree on this to a major extent. But there are ways in which being a technical professional, one can make optimal use of time and resources available from your CoE and use it to your own advantage, which effectively serves (partially though not completely) the goals of a CoE.

1) What is a CoE: In raw terms, CoE is generally a non-billable research & development unit within an organization, where an organization employs part-time and full-time staff, with the goal of competency building and developing accelerator designs & best practices to tackle foreseen and unforeseen technical challenges.

2) How does a CoE help me: There are many ways in which a CoE can help you.

Resources: Mostly you would not find unlicensed resources like hardware/software freely available at your disposal, unless and untill you are using it for your business. CoE is mostly equipped with a lab, where you would find almost all the resources on which you can work and experiment. For ex, you might want to work on MDS (Master Data Services) / Sharepoint 2010 for PPS, but you cannot do that on your own machine as it requires 64-bit hardware and installation, and of course a license. Being part of a CoE, you can avail access to such resources and get your hands-on experience on such technologies.

Networking: Mostly developers remain immersed into their own technology, which keeps their networking scope limited with professionals from the same pool. In a CoE, the most vital aspect one can learn is to work collaboratively to achieve a common goal. Also some experts are inevitably deployed in a CoE, to guide the team. And you can approach such professionals through CoE, though they may not be your PM / Team member.

Visibility: Mostly as I said earlier, we think that managers / management promote CoE to shine their own KPIs, but don't forget that to shine their KPIs they need deliverables from you. If you manage to highlight your work tactically, you have a very nice opportunity to showcase your talent to your organization's senior leadership by the route of CoE.

Technical Authority: By showcasing your talent in the right way to the right people, you can build a technical authority in your technical stream within your organization. CoE generally remains in charge of the best practices and deliverable quality measurement techniques and documents. Say for eg, you have developed a SSIS best practices document supported by respective POCs, eventually, you can virtually establish yourself as a SSIS SME (Subject Matter Expert) within your organization.

3) What have you ( Siddharth Mehta ) achieved till date from a CoE: I recently received Capgemini India Envoy Award for the financial year 2010, not exactly for being a part of CoE, but still due to major initiatives in alignment to the same. In my past career, I have been in charge of MS BI CoE at various levels. And from my experience, I feel that it's a great way to promote personal as well as organizational growth in terms of technical expertise.

Friday, September 17, 2010

Strategy Maps Tutorial

I'm reading: Strategy Maps TutorialTweet this !
Strategy Maps are one of the constituent elements of a dashboard solution. Development of the same starts in Visio, and then those maps are used in a dashboard developed using PPS. As a MS BI professional, we are generally aware of SQL Server and the extension of our knowledge reaches out to Sharepoint. But when the question comes of Visio, most of us would throw our hands in air. Data driven strategy maps working in sync with other scorecard elements can steal the show compared to a traditional dashboard with a few KPIs and a graph. With visio services introduced in Sharepoint 2010, this experience is made more smooth, easier and appealing.

Visio Team has published an article on how to create a strategy map using containers, and it's definitely worth checking out. This article can be read from here.

Wednesday, September 15, 2010

MS BI Architect Training Curriculum

I'm reading: MS BI Architect Training CurriculumTweet this !
Perception of the term Architect is quite different among technical professionals at different levels. Generally speaking, everyone who knows SSIS, SSAS and SSRS starts considering oneself as an architect. Now when training comes on the page, this becomes a very debatable topic, and when you consult someone on what should be the kind of training curriculum, I have seen people relying on trainers or marketing folks from training institutes who recommend some curriculum for an architect level training.

Below is a list of a few higher level points, that I feel should be included for an architect level training. It's not an exhaustive list, but at least it would provide a flavor of the kind of training, one should aim to grow as an architect. Again a word of caution, these are my views, and I am sure that there would be folks on either side supporting me and against me.

1) IaaS, PaaS, SaaS BI solution development methodology using MS BI Stack

2) Integrating ETL framework (i.e. SSIS) with industry standard relational databases DB2, Ingres, Oracle etc and non-relational data sources like SAP, Microsoft Dynamics

3) Introduction to competitive BI ecosystems available from other competitive vendors (Informatica, AbInitio, Business Objects, etc..)

4) Hands-on-labs on Fast Track Data Warehouse architecture for agile DW development using hub-and-spoke methodology

5) Introduction to appliance solutions like Parallel Data Warehouse and Windows Azure Appliance Solution.

6) Complex Event Processing (CEP) techniques using StreamInsight for real time business performance measurement

7) Economic BI solution development, for example, Dashboards development using Reporting services for enterprises that can't afford PPS.

8) Database and Dimensional modeling, BUS matrix development, Expert tips on Cube design methodology

9) Dashboard development using Sharepoint 2010 Business Intelligence capabilities (Performancepoint Services, Excel Services and Visio Services) and developing integration layer between SQL Server and Sharepoint BI solution.

10) Modeling business processes in Visio, to develop Visio Services enabled strategy maps for consumption in dashboarding.

11) Optimizing cube processing and MDX performance.

12) Detailed discussion on hardware setup and configuration recommended for massively large data warehouses.

13) MS BI Solution deployment on clusters and web farms.

Please feel free to share your views by sending me an email or commenting on this post.

Sunday, September 12, 2010

MDX Coding Standards for non-spaghetti code

I'm reading: MDX Coding Standards for non-spaghetti codeTweet this !
MDX is one such language that is not used as heavily as SQL, but coding standards or coding guidelines are one such aspect of development that needs to be applied to any programming language. Spaghetti code is one of the worst nightmares of any developers. Some of you might not know what does the term "spaghetti code" mean, though it a very popular term in the development parlance. In simple words, spaghetti code means a code that is like a crystal maze where it's quite complex to find the other end of the exit. In such code it's hard to figure out the tail of the code or the final result of the code when you start analyzing the code. Some key rules that I have learned from my experience to avoid such code getting created in MDX are as below:

1) Comment in detail about the query: When you use dimensions and measures in your MDX query, knowing the configuration and properties of MDX is quite important. It's always beneficial, if the intention of the query is made clear with a text explanation of the query logic in comments. This much it much easier to understand the query.

2) Try to make the code / query as explicit as possible: Many times the code becomes confusing due to the laziness observed while coding. For ex. one can omit specifying the measure to be used on any axis or on the slicer, if the measure to be used it the default measure. But consider that at some point in time the default measure of the cube needs to be changed, all the queries that has not been specified explicitly, the measure to be used, those queries would break.

3) Create a list of navigation shorthands: In MDX like in T-SQL, there are more than one ways of querying the same thing. For ex one can use brackets ( ), * operator as well as crossjoin function to achieve the same result. Another ex, one can use .parent.children function on a member and the same effect can be achieved by the .siblings function. In querying a cube, MDX helps how you navigate at a particular slice of the cube. One should make a list of common navigation functions that would be required in the code, and state down the shorthands to avoid creation of any spaghetti code.

4) Use functions instead of operators: In MDX, you can use * instead of crossjoin function, - instead of except function. Using text functions makes the code more readable and easy to understand instead of using the operators.

Above suggestions are based on my personal experiences and not any universal standard for MDX coding. One learns about the ways of avoiding spaghetti code only when one gets dumped into the spaghetti created by someone else. And fortunately or unfortunately this experience has made me conclude many rules some of which are mentioned above to avoid spaghetti coding.

Wednesday, September 08, 2010

MDX Interview Questions : How to prepare for SSAS MDX interview

I'm reading: MDX Interview Questions : How to prepare for SSAS MDX interviewTweet this !
As I serve / can serve on the interview panel for my employer, I cannot share any kind of interview questions, but this post is about how to prepare for an interview where you expect questions on Multi Dimensional Expressions (MDX). Below are certain points that should provide some hint / direction to keep in view, while preparing for your interview.


1) Work Profile: The depth and number of questions that you might face on the MDX section depends on the job profile for which you are appearing an interview. If you are appearing for a full time SSAS developer, expect the same level of brain storming on MDX as a T-SQL developer might face on T-SQL. If your interview is for a job profile of MS BI Tech Lead, MDX would be inevitably one of the sections. But that section might comprise of few complex queries to test whether you have ever worked on MDX. If you are a reports developer on a junior profile, you might skip away with questions on MDX, but if you are on a senior reports developer profile, you would still have to face MDX queries to a moderate level.


2) Cube Anatomy: If you do not understand cube anatomy, having knowledge of MDX would seem completely bookish to the interviewer. For ex. if you are not able to explain the difference between levels on attribute hierarchies and levels on user hierarchies, that would mean that though you have an idea of MDX but you do not understand how to navigate the cube using MDX. In T-SQL terms, this means that you know "select" command, but you do not know the difference between a view and a stored proc. In this case your knowledge on MDX would be rated on a scale of 1-3 on a scale of 10.


3) Operators and Functions: You should knowing the frequently used operators and functions in MDX. If you are poor at that, again it would project to the interviewer that you have bookish knowledge. No healthy querying can be done without operators and functions, and though not all, but if you do not have even an idea of even the frequently used MDX functions and operators for reporting purposes, your knowledge on MDX would be rated in a range of 3-5 on a scale of 10.


4) Effects of cube modeling: MDX is heavily influenced by the dimensional model of the cube. And many times by looking at the query results, one can tell the nature of the entity that is being used for retrieving the results or any issue with the dimensional model. For ex. if a measure is not associated with a dimension and you use them on two axes in your query, looking at the result, you can easily tell that there is a high probability that both are not associated. A clever interviewer would try this technique too to judge whether you have practically worked on MDX or you have just mugged up a few queries. If you perform well in this area, there is a high probability that you would score in a range of 5-8 on a scale of 10.


5) Interviewer's knowledge: Many a times it happens that interviewer might not be that good on MDX too. You need to score a good percentile, and not a good percentage. This means that you need to prove yourself competent enough to interviewer's knowledge. If you are just asked one question on MDX section like "Can you tell me a complex MDX query that you have used in your project or Can you tell me the syntax of MDX query", there is a high probability that the interviewer does not wish to screen you in detail on MDX or the interviewer himself / herself has limited knowledge on MDX. This means that you just hit a jackpot on your interview for the MDX section.


I hope this helps for all those who are scared of MDX. MDX is not at all similar to SQL, but also if you attempt to learn MDX without comparing it to SQL, MDX is a wonderful and a very powerful query language.

Sunday, September 05, 2010

RenderFormat.IsInteractive and RenderFormat.Name - Develop export aware SSRS reports

I'm reading: RenderFormat.IsInteractive and RenderFormat.Name - Develop export aware SSRS reportsTweet this !
It's said that sometimes "Big things come in small packages". This quote perfectly suits the new enhancement in SSRS 2008 R2, which is the newly introduced global variable "RenderFormat". Name and IsInteractive properties provides programmatic access to the name and feature capacity of rendering extension within the definition of the report. The main advantage is that one can create multiple version of the same report using the same report definition.

When the report is processed by a particular rendering extension, with the use of these properties is becomes possible to create report output that is suitable to be displayed by the application that hosts the file format in which report is saved. For example, one might want to generate a particular form of report output when the report is exported using Excel, and generate another form of report output when report is exported to PDF. Certain parts of the reports may be confidential or trademarks which an organization might classify as "company internal" or "confidential" and the same may be banned from using outside the company intranet. Effectively these should not be available on reports that are exported to other file formats. In such cases these properties can be extremely useful. This is one such example, there are many applications of this global variable and it's properties.

Recently I authored an article on the same topic, and if you want to see a demo of how to apply this concept, you can read this article from here. Please do let me know by your comments on the article, what you feel about the same.

Thursday, September 02, 2010

Execute or Trigger SSIS package when source files are available

I'm reading: Execute or Trigger SSIS package when source files are availableTweet this !
In any mission critical ETL solution, watching out for source feeds (probably in the form of files) and triggering corresponding ETL package to process the feeds is a very regular requirement. In SSIS task repository, File Watcher task is missing and many would answer the File Watcher Task is one of the probable solution to this requirement. Whether this task performs good or weak is another matter, but I am not of the opinion that any task should be used for this requirement at all.

In my opinion, there is no point is keeping the packages on stand-by and in execution mode indefinitely to process the data feeds. Consider a scenario where a global stocks trading organization receives data feeds 24 x 7, and there may be ETL jobs for processing feeds from each country or city. It is not a sensible design at all to keep all the packages running on stand-by mode using some tasks.

The question that comes to the mind is what is the solution for this requirement? In my views, a windows service that can be developed using .NET is one of the best solutions. Instead of using a polling mechanism or keeping packages on stand-by and executing them indefinitely, a simple windows service can be developed using .NET code. Using Windows Management Instrumentation (WMI) one can subscribe to windows events to watch out for any file creation in a directory and the same is easy to implement in .NET code. WMI is one of the way I had used way back before many years, but I am sure there must be better ways of detecting this using the latest version of .NET Framework.

Windows service does not require any active logon to the server and it can be configured to keep running in background. Once this service detects any file creation, it can kick start the package. Also the execution schedule and logic to trigger the package can be made configurable by making the windows service to read parameters from a config file or from database.

I do not intend to say that there is no good use of File Watcher Task, but in cases of scenarios like the one I mentioned above, especially in mission critical production environments, if I were to make a decision, I would use the technique I suggested. It would be nice if Microsoft comes out with a nice scheduler level support for such requirements.
Related Posts with Thumbnails