Sunday, July 31, 2011

Infographics in a BI Solution

I'm reading: Infographics in a BI SolutionTweet this !
These days my interests have been converging a lot on subjects related to extracting BI from unstructured data. Editing a few properties, learning a few functions, developing few queries for faster data access, authoring colorful reports and more tasks like these make many professionals feel so accomplished that they no more feel to broaden their horizons. In my personal opinion, such are good for professionals whose scope are limited to being product practitioners / testers / salesmen / market makers (I mean evangelists). I am sure that those who envision the world of IT, find these limits too short to contain their potential. Enough of thought work, lets get back to business.

Have you ever thought that if you would try to transform unstructured data into semantic data, and intend to report the same data, how would you report it? SSRS Reports are generally used for operational reporting and Dashboards are generally used to performance monitoring and measurement, know as CPM (Corporate Performance Measurement). But for example, when you try to structure data from a source like Wikipedia which is completely unstructured data, create intelligent structures to mine data, and intend to report the same, what would be the ideal way to report the same. In my viewpoint, intelligence extracted out of such data, can be effectively reported using Infographics. If you generally watch some Infographics gallery, you might find some dilbert kind of cartoon symbolizing some meaning. But Infographics are a very powerful way of reporting and gives you the flexibility to report data in a way that no dashboard / visualization can deliver.

Don't believe me ? Below is an example. Study it carefully and you would become a fan of Infographics. Data mined from unstructured data source can very well generate content to extract intelligence reported in the below infographic.

Monday, July 25, 2011

Data Warehousing and Analytics on Unstructured Data / Big Data using Hadoop on Microsoft platform

I'm reading: Data Warehousing and Analytics on Unstructured Data / Big Data using Hadoop on Microsoft platformTweet this !
A major community of data warehousing professionals grow up from the old school of Kimball and Inmon methods of data warehousing. Lots of professionals do boast on virtualization, complex MDX querying, performance tuning OLAP engines and managing data warehouse environments of the size of a few hundred GBs or several TBs, as the most niche and challenging jobs they have on their resume. But there is another world of data warehousing and analytics which most would not have explored, and slowly this revolutionary and emerging wave is reaching SMBs which would effectively challenge the world of data warehousing as we practice today. You might come across a question while reading this post, that what has Microsoft to do with it and answer to this question is towards the end of this post.

Data warehouses and data marts developed using Kimball, Inmon or any hybrid methodology can deal with structured data and have scalability challenges too. Appliance solutions such as Parallel Data Warehouse are Microsoft's candidate to deal with such challenges. Some might think that this is the answer to warehouse largest volume of data and build analytical capabilities on the top of it. But this data volume is just a very small piece of the ecosystem. According to Gartner, enterprise data would grow by 650% in 2014 and 85% of the same would be unstructured data, which is also termed as BIG Data.

Have you ever thought of how organizations like Yahoo, Google, Facebook etc organize their data? Which databases do they use? Whether they have data warehousing and analytics? These organizations have some of the largest data volumes in the world. For example, Facebook is heard to have 12 TB of compressed data added per day and 800 TB of compressed data scanned per day. Can you imagine structuring such volume of data using ETL, storing it in data warehouses, aggregating it using OLAP engines in data marts and extracting analytics out of the same ? To handle such volumes of data for data warehousing and analytics, innovative technologies and infrastructure design are required that can support massively parallel processing, and the one I am talking about is named "Hadoop" which is an open-source distributed computing technology and "Hadoop Distributed File System" which is the storage mechanism for handling unstructured data.

Cloud environments like Amazon are already supporting Hadoop, organizations like Cloudera and IBM are supporting commercial distributions of Hadoop, and a lot of big and famous international business majors are already using Hadoop implementation. The biggest implementation is used by Yahoo with 100,000+ CPUs running on 40,000+ computers running Hadoop. An exhaustive list of organizations using Hadoop can be read from here. Organizations are using Hadoop to implement data warehousing and analytics for purposes like Event Analytics, Click Stream Analytics, Text Analytics and more.

For those who are completely afresh to this part of the world, can go through some very interesting reference material mentioned below:

1) The Google File System

2) Data warehousing and Analytics Infrastructure at Facebook

3) Apache Hadoop Wiki

4) Apache Hadoop MapReduce Implementation at Yahoo

5) Setting up Hadoop on VM

Microsoft is aware of the challenges using unstructured data and Hadoop, and is gearing up slowly for the same.

1) Microsoft Research is developing Project Daytona on Azure platform and Project Dryad, which is perceived by the industry as Microsoft's candidate as an alternative for Apache Hadoop.

2) Those who believe that MDX is the top query language that can deal with huge amount of data from OLAP engines, should check out LINQ to HPC to update their GK.

3) With the increasing popularity and success of Hadoop, Microsoft is also supporting Hadoop on Azure platform. You can get an idea of how to deploy Hadoop cluster on Azure platform from here.

The way Microsoft professionals felt that cloud is something new when Azure was introduced, same would be the case when Microsoft would start supporting Hadoop commercially or introduce a commercial alternative for the same. But neither cloud is a recent invention nor technologies like Hadoop to handle, ware house and analyze unstructred data. In my viewpoint, architects and organizations should develop their readiness to deal with the emerging winds of change and upcoming potential business opportunites that unstructured data can offer.

Monday, July 18, 2011

DQS Cleansing Transform in SSIS - Data profiling and cleansing using SSIS and DQS

I'm reading: DQS Cleansing Transform in SSIS - Data profiling and cleansing using SSIS and DQSTweet this !
Data Quality Services has come up with some interesting concepts.

1) Two main pillars of DQS concepts are - Knowledge Base and Domains.

2) In laymen terms I would consider KB as tables and domains as fields of those tables. Domains have datatypes, constraints, and other attributes just like fields of a table. Domains can also be hooked with reference data providers, to get enumeration of valid and possible values.

3) Composite domains are combination of one or more domains and makes up a complex combination, which is synonymous to calculated fields.

4) When data is passed against these domains, it acts like a regular expression match on the data that is matched against the domain.

5) After the data match against the domain, it applies fuzzy logic kind of algorithm similar to what SSIS Fuzzy Lookup transform. Based on this feature, concepts like "confidence" against the matched value and options to correct the data is offered.

A tool packed with all these features is very useful for data stewards i.e. data quality analysts and operators, and that tool is Data Quality Client. From a higher level if you analyze these points, they all collectively fit in a way to function as a transform. DQS Cleansing Transform in a new transform introduced in SSIS Denali. A very informative article from SSIS Team demonstrating the use of this transform can be read from here. Another great informative article on DQS Cleansing Transform is available from DQS Team, which can be read from here.


Creation of knowledge base and domains is much like creating tables and fields, and if DQS provides an interface to import tables from source systems in the form of KB and domains just like Data Source View, it would make the process very easy and make the tool more friendlier. Honestly, I feel that organizations would have their knowledge embedded in the metadata of database objects. And creating that kind of KB and domains again is not a light weighted exercise. Let's see if such facilitation gets added to DQS in the time to come.

The bright side of DQS is that cleansing becomes more decoupled, powerful, and data profile task and data profile viewer would complement the capabilities of DQS as data profiling and data cleansing are closely associated processes. I would not be surprised if Data Profile Viewer and Data Profile Task gets dissolved into DQS and a new transform called DQS Profiling Transform gets added to SSIS toolbox in Data Flow along with DQS Cleansing Transform !!

Friday, July 15, 2011

MS BI for Time Series Analysis, Deviation Analysis, Regression Analysis, Correlation Analysis and Distribution Analysis

I'm reading: MS BI for Time Series Analysis, Deviation Analysis, Regression Analysis, Correlation Analysis and Distribution AnalysisTweet this !
Few questions are very important to get answered before anyone dives into the sea of business intelligence. You would find many professionals who cannot make out the difference between reporting data and business intelligence. I recently met one senior professional having approx 14 years of experience, and he was not clear of what is a data warehouse. He used to consider anything that stores data in the form of dimension and facts tables is a data warehouse, which is completely incorrect. The biggest drawback of this lack of understanding is that one cannot understand the life-cycle of how an organization gets BI ready.

I define BI readiness in 4 steps : Data Intelligence, Reporting Intelligence, Integration Intelligence, Business Intelligence. You can read more about this in my article titled "
Select a BI software with full knowledge of what it does".

Now say that you understand the importance and concept of gaining organizational data maturity to harvest Business Intelligence. But the next question is that if an organization wants to get BI ready, do they need to open up a new data center or a few servers running on memory steroids? Cloud is a growing trend for infrastructure elasticity, and Microsoft is also gearing up fast on Azure platform. But again the question is, are you ready for Cloud BI?

Migrating or developing BI solutions on the cloud needs an assessment of your existing line of business systems. I have authored another article titled "
5 cloud BI considerations for a successful rollout", which can be read to gain a little deeper insight into this topic.

Finally when your understanding of BI and your infra requirements to host the same are resolved, one another and most important question would hit you - How to recognize / build a true BI software / solution ? Every business has Sales, WorkForce, Products, Business Operations and other Business As Usual constituents. If you have ever studied statistics and statistical methods which are used for analysis by senior business management to analyze different aspects of the business, you would have heard of analytical methods like Time Series Analysis, Deviation Analysis, Regression Analysis, Correlation Analysis, Distribution Analysis and more. These are high level categories of analytical methods and needs a mathematical and scientific approach to analyze and visualize data.

Based on the analytical capabilities of your BI solution, you can assess its BI value. To understand and assess any BI tool you should consider to assess these methods, and to read more about how to analyze any BI tool / software, you can read my article titled "Business Intelligence tools Analyzed" where I have explained four essential analysis features for BI solution. Once you understand what these analysis methods are, you can try to figure out features in MS BI which can help you build these forms of analysis, and then you can derive if MS BI is a powerful BI solution development platform.

Feel free to share your feedback on these articles.

Wednesday, July 13, 2011

Install SQL Server Denali CTP3 - SSDQS and BISM leads the show

I'm reading: Install SQL Server Denali CTP3 - SSDQS and BISM leads the showTweet this !
SQL Server Denali CTP3 and SQL Server 2008 R2 SP1 have been publicly released, and is available for download. You can read about the official announcement from here and the quick link to download Denali CTP3 is here.

Star of the release seem to be SQL Server Data Quality Services and Business Intelligence Semantic Model !! Yes you are reading it right, I didn't say SSAS, I mentioned BISM. There are a lot other new exciting features that shows its glitter right while installation itself. As they say, "A Picture is worth thousand words", and without making you all read too much of instructions, below are a few significant screenshots from my Denali CTP3 installation in my VM.

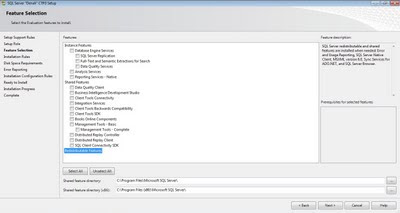
Installation is quite straight-forward, but you would find additional tab pages while installation. In the below screen you can see new features for selection like Data Quality Services, Data Quality Client, Distributed Replay Controller, and Distributed Replay Client.

If you analyze carefully, DQS is classified under Database Engine Services category. This itself gives the first insight into the architecture of DQS. In my understanding, as its contained in the database engine service probably as an object model, you can set up different instances of DQS only by creating different SQL Server instances. Data Quality is closely associated with data, so it makes sense to position DQS more close to DB than classifying it as a shared features. But from a scalability perspective, my immediate train of thought says that it would have been better introduce it as a separate service in itself so that one can create several instances of DQS on different servers, group the same in a cluster and create a Data Quality Control center. But that would require DQS to be an independent and matured service of the likes of SSAS and SSRS with supporting client tools. So I am happy for now having DQS as a feature under Database Engine Services. To complete DQS installation, follow the steps mentioned here.

Thankfully, DQS team has announced DQS Team blog, which would be a driving resource for the community looking forward to DQS. Expect more updates on SSDQS from me very soon.


After a few screens, you would find the glimpse of BISM. You would get options to select Multidimensional mode (OLAP and SSAS) or Tabular Mode (Powerpivot and VertiPaq Engine). This seems the realization of the vision of enabling users to choose OLAP or Tabular data and querying it with MDX or DAX, with any combinations.

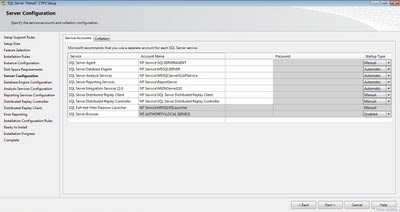
After that you would get few other new pages.


Finally once you have installed entire tools and services, just open BIDS and see the new world that is getting ready at Microsoft to bring new winds of change in MS BI.

Monday, July 11, 2011

MS BI Architecture Design Layers - classifying layer specific logic

I'm reading: MS BI Architecture Design Layers - classifying layer specific logicTweet this !
Any architecture design diagram is composed of several layers vertically and horizontally. Horizontal layers are discrete logical areas and their association in the diagram describes the way they are connected to each other. Vertical layers run across the entire solution and all these logical areas, which means they are applicable throughout the solution. For example, data repository can be classified as a horizontal layer and auditing can be classified as a vertical layer. This is a very well known fact and most of us would be knowing this very well.

When it comes to implementation, the association of these layers are honored and the solution is developed keeping this layers in view. But this is only in terms of how these layers are associated with each other, i.e. data and process would flow vertically and horizontally as defined in the architecture diagram. One very vital point that many miss is where to deploy your logic. Below are few logic deployment challenges or confusions that most of us would have faced as decision makers at some point of time in our careers:

1) Should logic be stored in .NET App or in DB Stored Procs

2) Should logic be stored in Stored Procs in OLTP DB or in ETL package

3) Should logic be stored in scheduled batch jobs or in ETL driver package

4) Should logic be stored in Stored Proc or SSRS Report

5) Should logic be stored in SSAS MDX Script or Client App

6) Should logic be stored in Dashboard or SSAS Cube

I have seen many genius taking their comfort route to make their jobs easy and jeopardize the future of the solution, just by deploying the logic that belongs to one layer of the architecture into another layer.

Once I had come across a scenario where one genius project manager tried to defend a solution with the argument that as the application was designed as a reporting application, entire logic is stored at the report level. This means SSRS RDLs contained the entire query logic and formatting logic within it. The solution in discussion was developed as a reporting application, and after few months down the line the requirement came up to act as a data source for other systems. As the logic was completely embedded in reports, it was not reusable at all and the solution design fell flat. Looking at embedded SQL in RDLs, any logical developer would ask, what an uncompiled SQL is doing in SSRS report ? SQL belongs to DB inside a SP and formatting the UI of the report is the report specific logic that can be contained in reports.

I have also been evident of scenarios where an application architect is in the driver seat, and the approach pursued it to embed entire logic into .NET code and treat DB as a blackbox to pump-in and pump-out data. In any corporate IT systems history you would find that application layer i.e. the User Interface / Web Front End layers are changed like changing the curtains of your windows, but corporate DB are hardly changed and whenever DBs are migrated they are a result of a large scale corporate IT systems revamping exercise.

I do not intend to hint that all logic should reside in the DB. Whatever logic that belongs to a particular architecture design layer, it should be deployed in that layer only, which is one of the implicit communication of layering in an architecture design diagram. Entire functionality can be achieved by deploying code in a single layer of the solution, but in the long term it would defeat the very purpose of layering and design patterns. Dissecting the right part of the logic in the right layer, followed by best practices of developing the layer would provide the most ideal solution from a stabilized solution design perspective.

In the field of technical architecture design, my career experience has been that each piece of logic should remain with it's deserving layer. Feel free to prove me wrong !!

Sunday, July 10, 2011

Evaluate MS BI Architecture Design

I'm reading: Evaluate MS BI Architecture DesignTweet this !
Architecture Design of any solution in general is done by a solution architect or a group of architects like App Architect, Data Architect, Infra Architect etc and this group is guided by a solution architect. Design is one part of the SDLC but other part is reviewing the design. Design review is generally a very debatable matter, and almost every time there is a design review, one can expect a debate on right and wrong. The reason for the same is none of the sides have a defined parametrized process, against which one can assess the design. And as every design as well as design review is carried out on one's gut feeling and historical career experience / organizational design templates, design review ends up just as a formality than as a productive exercise.

There are two ways to deal with this issue.

1) Architecture TradeOff Analysis Method (ATAM) : It's an ideal solution where architectures are designed in an ideal way. If you live in an ideal world, the SEI Architecture Tradeoff Analysis Method (ATAM) is the leading method in the area of software architecture evaluation. An evaluation using the ATAM typically would require a trained evaluation team, architects, and representatives of the architecture's various stakeholders. You can read more about this from here. This kind of review would also prepare you to shield your architecture against any audits like CMM, PCI etc.


2) Custom tailored design review process: The above mentioned design review process is a very standard one from a SEI perspective. If you live in a non-ideal world, many organizations would not be complying to SEI methods, standards and practices. Even those organization that claim to comply, would not have their 100% projects complying to the SEI methods. For projects and organizations of those scale, a very modest complexity of evaluation process is required, where a modest team or even a IT professional that wears many hat can conduct the design review.

For projects and requirements in such orbit, a custom tailored methodology for design as well as review should be defined, and architecture should be based on the defined method. One cannot develop the architecture on X method and review it against Y method. I have posted about one such custom tailored architecture design document template earlier, which can be read from here.

I by no mean intend to signal that one should avoid using ATAM, but if that method is not achievable start with a custom tailored one, which of course would not be a standard one. But once you have the maturity, skills and resources at your disposal, you should try to benchmark your architecture design against SEI standard methodologies, and that evaluation would be the correct design review for your architecture.

Wednesday, July 06, 2011

Data warehouse planning tool

I'm reading: Data warehouse planning toolTweet this !
Data warehouse planning is practiced more as an art than as a science. Art is something that one learns with a gifted skill to pursue the craft and deliver the end product. While science is something that anyone with the correct logical algorithm can apply to create the end product. Consultants step in with their own set of questions and start a psychometric analysis class in the office of a CxO of the company, this is a typical way in which most of the data warehouse planning and assessment starts. The end users or the analysts with the organizations have very little clue of why the questions are being asked and what would they derive from it. If someone from the IT Operations of the enterprise approaches the consulting firm regarding the credibility of the process, consultants would pull out a Data Warehouse Toolkit book and justify their theory, making clients almost perceive that data warehouse planning is an art not a science.

How can data warehouse planning become a science ? If the regular set of processes defined to plan and asses data warehouse engineering are available, and the same processes are built into a tool in the form of a workflow, then it becomes science. Any reasonably experienced data architect / BI analysts can use the tool, understand and fill up the workflow with data points and create an assessment, plan the model and come out with a prototype to evaluate the design of a prospective data warehouse.

In the Microsoft BI world, till date the most easy and popular tool of choice for planning a data warehouse, in my knowledge, has been the data warehouse modeling worksheet available from Kimball's Data Warehouse Toolkit book. This worksheet helps at the requirements gathering and modeling level, but not much at the planning level.


The motivation of this post is a new tool that has hit the BI market, and the name is WhereScape 3D. Presently as of the draft of this post, this tool is available as a free trial beta. I gave a try to this tool, and it seems quite of the modeling flavor. In my personal opinion, the tool is not that self explanatory even for a BI Analyst to start using it in a fast track manner, it would require the analyst to learn the tool for a day or two and then start capturing requirements and planning for the warehouse. The striking features is the documentation part, and its one of the unique tools I have come across till date that help the user in modeling the requirements itself to plan the DW right from source systems to data mart. You can read more about this tool from
here and download the same from here.

At this time, I am not sure too much about how effective is the tool, but I am pretty impressed by the value it aims to bring to the table and that is indeed one area that has not been targeted by BI product vendors till date. I am sure this is the start of a new race where vendors would start converting enterprise class DW to science, rather than restricting it as art !!

Sunday, July 03, 2011

SSRS Reportviewer webpart / control REPLACEMENT / ALTERNATIVE

I'm reading: SSRS Reportviewer webpart / control REPLACEMENT / ALTERNATIVETweet this !
SSRS Reportviewer webpart in Sharepoint and SSRS Reportviewer control in .NET are two major application interfaces to SSRS from the microsoft application world. UI limitations and lack of programability of reportviewer control continues to remains a challenge for the application world, as this interface visibly floats out as an odd component from the theme of application.

One of the elegant mechanism that most application environments are resorting today, is an alternative to using this control. And this alternative is by using the SSRS webservice directly. In my whitepaper "Bulk report generation using SSIS and SSRS 2008 R2", I have demonstrated how one can use SSRS webservices, which is a classic example of how much control client applications can gain by consuming these services directly.

How can applications benefit by using SSRS webservices directly and replace SSRS Reportviewer webpart / control ? The technique to implement is as below:

1) Execute your report by calling correct functions from the webservice
2) Collect the output stream in HTML format
3) Display the output on the application page.

This sounds very straightforward, but it is not free of challenges.

1) Firstly one would need to create a custom control, and then embed this functionality within this control.

2) Secondly, report output can contain images too which would be sent by the output stream without any image extension. Displaying the same would not be straightforward. You might need to stage those images to disk, or modify the IIS settings for your application. Code sample in SSRS SDK for PHP shows a fine example of how to deal with this issue.

3) You would not have parameters, page navigation or report exporting functionality, and you would have to program the same yourself too.

But if you have a die-hard requirement to blend SSRS reports with the user interface of your application, instead of abandoning SSRS or duplicating entire report functionality within your Sharepoint / .NET application just due to the limitations of reportviewer webpart / control, a better way out is to replace the reportviewer webpart / control with a custom control, and program and embed your functionality within the same.

I hope someone from Microsoft is reading this post and taking a note of this burning requirement from the application programming world.
Related Posts with Thumbnails