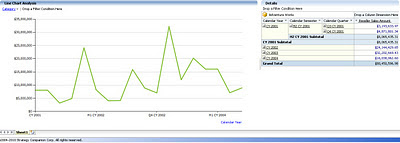
In this Analyzer Recipe we will take a look at how an intelligent reporting solution can bring that difference to operational data analytics with simple though effective sophistication. For the purpose of discussion, we will take as an example Line Chart Analysis. Line Charts typically draw a graph connecting a series of continuous data points. In the below screenshot, you can see a simple report I have created using a simple line graph and pivot grid. The chart contains a reasonable number of data points for reseller sales amount. The same data is also represented in the grid for a detailed view. The immediate question that should come to the mind of regular users of such reports is, what more can be improved in such reports? We will look at that now.

Many would not know that a more sophisticated form of line chart is the spline chart. Say your capture systems have acquired limited and non-continuous operational data, and you intend to create an intelligent trend out of your limited data. The spline chart is an intelligent option that would fit a curve through your data. With just a simple change in the graph type, the report would look like the below screenshot. If you compare the graphs in the above and below screenshots, you would find that the increase and decrease in the data is shown much more minutely in the spline graph compared to the line graph. You can use the grid to confirm this. For a better experience, try both graphs with non-continuous data, and in that case line graph would not give you a continuous curve, whereas the spline would provide a smooth graph out of your non-continuous data.
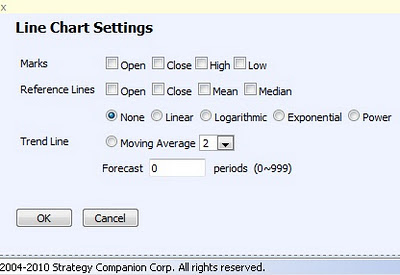
Analyzer charts provide interesting and advanced options for line charts (as one example of many chart types available) as shown in the below screenshot. So users who excel in sophisticated operational data analysis, can bring in the required scientific analysis using the below options, without the need to migrate from their regular graphs that might be used by a broad category of operational data analysts. In this way the more basic needs of the general user are taken care of, while at the same time enabling the “power users” to do their own advanced analysis and reporting, using the very same tool.

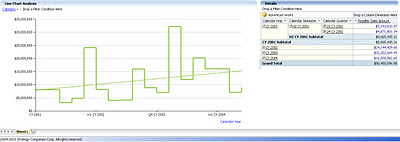
By changing the chart type to Step Line Chart, which is a more sophisticated form of a line chart, and including a trend line for linear moving average using the options shown in the above screenshot, an interesting trend can be created out of the operational data which is not that clearly visible in the above two types of line charts. With the moving average reference, analysts can always see whether the trend is constant compared to the moving average, which would not be that clear in the absence of this reference line.

In my views, the real power of a reporting solution lies in the ease and effectiveness with which it can make that data visible to the users that is not instantly visible to the human eye. Also, when users do not need to train themselves (or worse yet, go to a training class) to use sophisticated visualizations, and they can continue with their regular tools of the trade which provide an acceptable level of “polishing”, users will be able to adopt and use the reports and reporting solution with the impression that it’s their regular analysis tool with a flavor of modernization in it.
We saw how a line chart can be easily converted to a spline chart for analysis of limited data and better curve fitting purposes, and how this can be converted to a step line chart for better trend analysis with advanced scientific options. Analyzer has many more other such chart types and options, and you can visit the Analyzer web site to explore them more.


 Article


No comments:
Post a Comment