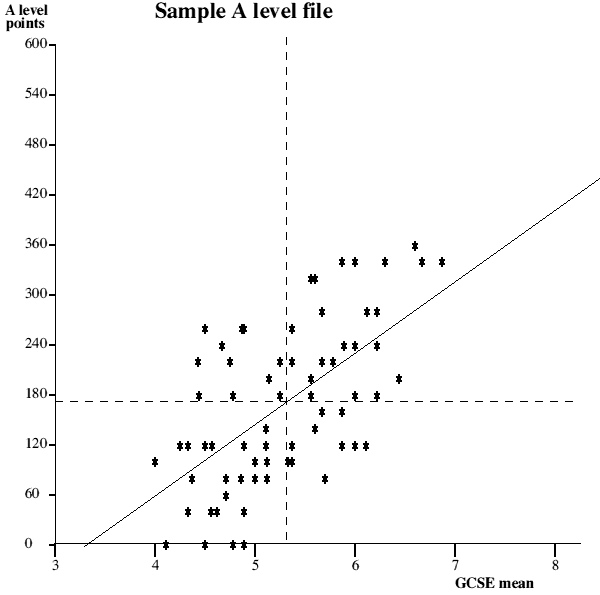
1) Box plot / Scatter plot charts - These charts are mostly used for outliers analysis.

2) Candlestick charts - For analyzing extremely volatile data like movement of a particular stock during the day, with associated values like high-low-open-close.

3) Line charts / Range charts: For displaying multiple trends on the same graph for trend analysis and correlation analysis.

4) Tree map / Performance map: For portfolio analysis and measuring weighted values of each item within a portfolio.

5) Decomposition Trees: For problem decomposition using drill-down and drill-through techniques in the same visualization.
.jpg)


 Article


No comments:
Post a Comment