Microsoft Excel is one of the most widely used tools for a variety of business purposes, due to its simplicity, calculation abilities and efficiency as a client tool for accounting purposes. Excel is the tool of choice for not only business users, but for a wide variety of users, right from field engineers collecting data from at the ground level to power-users validating and accounting for this data. Excel worksheets loaded with thousands of records are a huge source of data. But Excel is not meant to be a database management system or a reporting platform either.
Traditional data warehousing methodologies involve developing relational warehouses that are populated from sources using an ETL process – Extract, Transform, and Load. Data from these relational warehouses are processed and stored in analytical databases, which host cube and other data structures. SQL Server 2012 introduces tabular mode Analysis Services and the new Business Intelligence Semantic Model to deal with this scenario. This model requires usage of a new query language known as DAX (Data Analysis eXpressions). As it is a complex process to transform relational data into a dimensional model to facilitate robust analytical capabilities, business users often have to accept tradeoffs and constraints on their ability to perform analytical reporting. These tradeoffs are due to the limitations associated with provisioning data in analytical form. In this Analyzer recipe, we will take a look at what features Analyzer has to deal with this challenge.
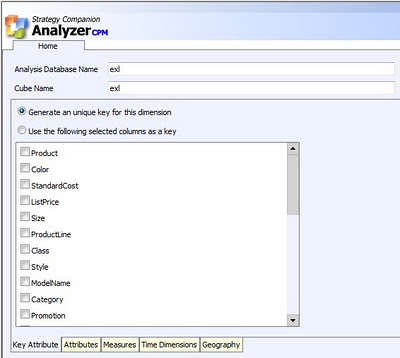
The latest version of Analyzer introduces a new feature known as Data Packages to deal with the scenario discussed above. This feature provides the user with the ability to upload their data in Excel / Access file formats. After upload, options are provided to create a model for reporting, and the same model is created as an analytical model for intelligent reporting. Consider you have products-related data from Adventureworks in a flattened Excel file, having 60K records and a lot of fields. After the file is uploaded, all the attributes are listed as shown in the below screenshot. All the attributes are grouped in a single dimension by default. Dimensional modeling requires every unique entry to be associated with a key attribute. This is taken care of by an option to generate a unique key.


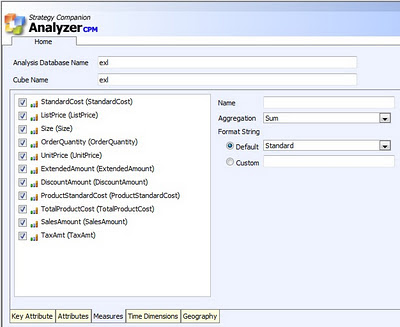
The Attributes tab facilitates selection of attributes for the dimension, and the Measures tab allows selection of measures. All numeric fields are identified by default as measures. Time is one of the most important dimensions in any dimensional model. Fields having date / time are identified to be configured as the key for a time dimension. Once the model is configured, it can be saved for later processing or can be processed in place. After processing, Analyzer creates a dimensional model and deploys the solution to the SSAS instance configured to be used with Analyzer. Apart from attribute selection, the entire process of deployment is entirely transparent to the end-users.
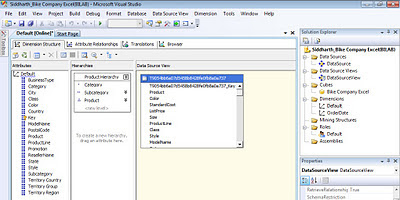
One important point that comes to any seasoned SSAS practitioner’s mind is how users would browse attributes. For example, Category -> SubCategory -> Products is a logical and natural hierarchy. Two questions that arise are 1) How would the users know whether a hierarchy exists? 2) How to build this hierarchy? When the model created from the uploaded files is deployed to SSAS, a dedicated database is created for it. If the database is opened using BIDS, it can be easily edited to enrich the model and build a hierarchy. The best part of the entire Data Packages solution is that the model is deployed as a normal SSAS solution and no proprietary encrypted code is injected, as seen in the below screenshot. This allows you to use BIDS with the Data Packages feature, should you wish to enhance an Analyzer-generated cube. Creating such a hierarchy would give a clear visual clue to the user of how to interpret and use the data, but creating the hierarchy would typically require intervention from the IT department as an end-user cannot be expected to accomplish this.

Even if the end-user does not have that support from their IT department handy, it is not a show stopper. Users might not get the visual clue of a hierarchy, but if users are well informed of the data they intend to analyze (which they should be) then Analyzer works on the intersection of fields and provides the same data browsing and reporting experience with/without a hierarchy in place.
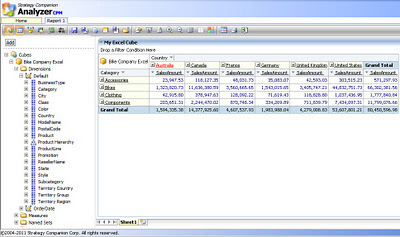
The below screenshot displays the hierarchy of products on the rows axis, and it has Country->City on the columns axis. Without even creating a SSAS hierarchy, based on the association of data, Analyzer detects the relationship and displays data in the same way. From a fluid data source like Excel, which has fluid data types and virtually no metadata, Analyzer creates an analytical model transparently. Once the model is available, users can benefit from the intelligent reporting capabilities of Analyzer, without the time and resource-consuming hassle of the IT-supported provisioning process.

Without even a BISM, Analyzer has its own version of a BISM that works transparently for end users and equips them with analytical models on the fly for intelligent reporting capabilities. One of the main differences between the two is that the Analyzer “BISM” works with any version of Excel and does not require SharePoint or SQL Server 2008 R2 or SQL Server 2012. To find out more about this exciting and unique new feature, download an evaluation version of Analyzer.


 Article


