Showing posts with label SSAS. Show all posts

Wednesday, July 20, 2016

Fast Track SSAS and MDX Training using SQL Server 2016

I'm reading: Fast Track SSAS and MDX Training using SQL Server 2016Tweet this !
It's a long time since I blogged, as I have been very busy with my authoring assignments and my regular day job.

I have created a course to learn SQL Server Analysis Services ( SSAS ) and MDX on fast track using SQL Server 2016.

In case you would like to subscribe to the course, here's the link:

https://www.udemy.com/ssas-sql-server-analysis-services-2016-mdx-training/?couponCode=PROMO50

By using this link, my blog readers can avail 50% OFF on the course price till end of July. I hope you find the course useful.

Thursday, February 07, 2013

Building Social Analytics with MS BI

I'm reading: Building Social Analytics with MS BITweet this !
Every form of analysis needs data, but it's not possible that one might have that data generated and stored in organizational repository. Many forms of analysis depends upon data from third-party, and platforms like Windows Azure Marketplace are based on the same principle.

Social Analytics is widely used to forecast the impact on the business and extract insights to counter the same. The interesting question here is, what is the data source that can be used to calculate / derive sentiments of customers related to the respective business ? A majority of this data would come from social / professional / collaboration forums. Examples of such sources are Facebook, YouTube, Twitter, LinkedIn, PInterest, IMDb, Blogs etc. Anyone would agree that the analytics derived from unstructured data created by the public interaction on social media can be expected to be much more close to precision than even any data mining algorithm. But the big question here is, the amount of data - very very very big data. On a daily basis, there are 400 million Tweets, 2.7 billion Facebook Likes, and 2 billion YouTube views. Even these figures might have been outdated today.

Say an organization is influenced by Sharepoint 2013 enhancements related to social media collaboration, and intends to add an ability to derive sentiment analysis in their client offering. Let's say that as a starting source, Twitter is selected as the source of data, and all the public tweets for a particular product would be analyzed and the results would be stored for future use. 

The first challenge is that according to a study, Twitter generates approximately 1 billion tweets in less than 3 days. So how to deal with processing such a huge amount of unstructured data and just consider the kind of infrastructure required to handle this processing. To proceed with the case study, let's say that we live in the age of cloud and we just signed up on AWS and have beefed up a fat Amazon EMR that uses Hadoop and HBase NoSQL database.

The second challenge in this case is how to get access to Twitter Firehose - an API that provides streaming access to Twitter public tweets. One needs to partner with Twitter and pay millions of dollars to get licensed access to it's sea of unfiltered dataset. Also you would need rights to publicly sell this dataset to your end-clients. Considering this complexity any organization would give up the idea of implementing it for own use.

Sometimes the answer to the problem is not technology but it's partner technology. Only three publicly known companies have licensed rights to Twitter's Firehose - Topsy, Datasift, and Gnip. These companies have established partnership with hundreds and thousands of social media platforms, established a web scale and google inspired flavor of infrastructure based on Hadoop clustering methodology, and also have been maintaining a huge archive of historical social data. On the top of it, these providers provide real time access to live stream of social media and also provides social analytics using intelligent methods. An interesting case study of how Datasift manages infrastructure for huge processing, storage and analytics can be read from here.

How MS BI is related to it ?

Even if one selects to sign-up with any of these providers and source analyzed data from them, one would have to keep storing the results. These providers have pay-per-use pricing model depending upon the selected source. After  intelligently extracting analyzed data from different sources through these providers, one would have to warehouse the same to avoid paying repeatedly for the same data. Considering the volume of data, even if analyzed data from these social media providers is warehoused, it would easily create a huge warehouse of data.

Microsoft have two different flavors of analysis models (Tabular mode SSAS and OLAP mode SSAS) under the BISM umbrella and a very strong set of end user collaboration platforms including Sharepoint and Excel. Analyzing the warehoused data from social analytics providers with MS BI and including the same in solution offerings can be a deal breaker than implementing complex data mining algorithms or such methods.

I would really like to hear what Microsoft thinks about my idea around social analytics with ms bi. Anyone reading this post is interested in sharing their thoughts about this idea, I would be more than happy to receive the same.

Saturday, October 06, 2012

Using Microsoft Office Project Server with MS BI ( SSIS, SSAS, and SSRS )

I'm reading: Using Microsoft Office Project Server with MS BI ( SSIS, SSAS, and SSRS )Tweet this !
Microsoft Office Project Server (MSPS) is one of the healthiest source of data in the microsoft ecosystem. Many departments especially CIOs have the greatest potential and probability to make extensive use of the data contained in Project Server. Almost every organizations have different projects for which they carry out planning, tracking, monitoring, resource assignments and related activities. MS Project Server is a chef's knife for this purpose.

From a technical standpoint, the way MSPS stores data is very interesting. Like Sharepoint, it stores data internally into SQL Server. But unlike Sharepoint, it gives a very neat and clean mechanism to use to data it stores internally in the form of a database intended for reporting known as Reporting database and is operated using a service known as Report Data Service. Also it has a service called Cube Build service (CBS), which can be operated using a web based console known as Project Web App (PWA).

The Reporting database (RDB) is the staging area for generating reports and OLAP cubes. Data in the Reporting database is comprehensive and is updated nearly in real time. The tables and views are optimized for read-only report generation; for example, the RDB tables are denormalized to provide redundant data and reduce the number of relational tables. As data is updated in real time in RDB, in case if you are considering extracting data from it to some other data store, consider reading how data gets to the RDB and Report Data Service. Schema documentation of the reporting database as well as the OLAP cubes is available and  can be downloaded from Project 2010 Reference: Software Development Kit, in the documentation\schemas subdirectory.

Microsot Office Project Server 2010 Architecture Diagram can be seen below:


As apparent in the above diagram, MS Project Server is very well integrated with Sharepoint 2010. Hence using reporting related tools like Excel Services, Performancepoint Services and BI + Dashboarding capabilities in-built into Sharepoint, a rich reporting platform can be provided to end users from data contained into Project Server 2010.

From an MS BI perspective,
  • SSIS can be used to extract data from reporting database and merge this data into a corporate warehouse
  • SSAS can be used to source and enhance cubes and OLAP database exposed by project server
  • SSRS can be used to generate reports on the top of OLTP reporting database and cubes contained in OLAP database exposed by Project Server.
I seriously wish that perhaps Sharepoint can expose such databases for reporting and analysis, as that makes it very easy to facilitate reporting and analysis of the content stored in sharepoint.

To understand more about Project Server, you should consider reading about Project Server Architecture and Project Server Programmability. Also consider reading more about how to configure reporting for Project Server 2010.

Thursday, July 05, 2012

Data warehouse certification , Business Intelligence and Analytics certification

I'm reading: Data warehouse certification , Business Intelligence and Analytics certificationTweet this !
In Data warehousing and Analytics, lack of standard certifications have made it very hard for recruiters to identify "A" league professionals from impostors. When the topic of certification comes, there are basically two questions, why to get certified and how and what to get certified. I would first answer what and then answer why. 

Irrespective of technology, The Data Warehousing Institute (TDWI) has been a provider of Certified Business Intelligence Professional (CBIP) certification where professionals can choose their core skills and appear for the exam that suits the same. The flip side that professionals see to it is that it's not associated with any product in specific and just theory can be good at Architect profile but at career levels where professionals need to implement solutions this might not be able to impress recruiters with this certifications.

Being a Microsoft patron, I would discuss about certifications related to MS BI. Microsoft has recently introduced two certifications for Data Warehousing and Business Intelligence.

1) Exam 70-463 : Implementing a Data Warehouse with Microsoft SQL Server 2012

Skills Measured:

  • Design and implement dimensions
  • Design and implement fact tables
  • Define connection managers
  • Design data flow
  • Implement data flow
  • Manage SSIS package execution
  • Implement script tasks in SSIS
  • Design control flow
  • Implement package logic by using SSIS variables and parameters
  • Implement control flow
  • Implement data load options
  • Implement script components in SSIS
  • Troubleshoot data integration issues
  • Install and maintain SSIS components
  • Implement auditing, logging, and event handling
  • Deploy SSIS solutions
  • Configure SSIS security settings
  • Install and maintain Data Quality Services
  • Implement master data management solutions
  • Create a data quality project to clean data

2) Exam 70-467 : Designing Business Intelligence Solutions with Microsoft SQL Server 2012

Skills Measured:

Keep in view this exam has approx 30% weightage on designing and planning of BI Infrastructure.
  • Plan for performance
  • Plan for scalability
  • Plan and manage upgrades
  • Maintain server health
  • Design a security strategy
  • Design a SQL partitioning strategy
  • Design a backup strategy
  • Design a logging and auditing strategy
  • Design a Reporting Services dataset
  • Manage Microsoft Excel Services/Reporting for SharePoint
  • Design a data acquisition strategy
  • Plan and manage reporting services configuration
  • Design BI reporting solution architecture
  • Design the data warehouse
  • Design a schema
  • Design cube architecture
  • Design fact tables
  • Design BI semantic models
  • Design and create MDX calculations
  • Design SSIS package execution
  • Plan to deploy SSIS solutions
  • Design package configurations for SSIS packages
Why to get certified on Business Intelligence platform ? There are two groups of people divided by faith in certification, one who believes in certifying and benchmarking their skills, others who do not feel there is any value in investing and getting certified.

1) For those who are not in the favor of certifications, the prominent reasons are:

  • Product version changes after few years and the certification is seen as outdated by recruiters
  • Software required for the same for practicing is not available easily
  • Many professionals indulge into malpractices, use exam dumps and pass exams with full score even without any knowledge of the subject
  • Its hard for them to self-study and prepare for certifications, and they don't have enough resources to invest into a professional training programme.
2) For those who are in the favor of certifications, the prominent reasons are:

  • Certifying your skills with changing product versions reflects your attitude to your employer, about how seriously you take your skills that earns your bread and butter.
  • With cheap developer editions coupled with free virtualization software like VirtualBox and readily installed images in VHD format, resource management is possible for them.
  • Professionals who pass exam using corrupt methods are digging a backfire gunshot for themselves as they are raising expectations from them, and inviting their interviewer to screen them more thoroughly as they are certified professionals.
  • Those who can't self-study in IT and can't manage in investing for resources and training programmes for themselves, have already surrendered to the thought that one or other day they would go obsolete in technology. And delivery management or other avenues are right for them than remaining technical. Even in that area, certifications like ITIL or PMP or PGMP would be required.
  • Certifications adds bargain power to your resume to negotiate better for your skills as you go up the ladder. With a couple of years of experience and few certifications you can't ask for 1.5 times the salary that your peers get paid, but the benefit is when your experience meter hits double digit in number of years, you won't be appearing your first ever certification at that age and experience !!
Summary: Invest in your career. Many would ask what certifications have I appeared till date. I am certified MCSD in Microsoft .Net, MCTS in SQL Server Implementation and Maintenance, MCTS in Business Intelligence and MCTS in Performancepoint Office Applications and now working as a senior architect with Accenture Services Private Ltd at Mumbai office. Still I am interested and positive to take up above mentioned certifications.

Wednesday, June 27, 2012

How to use MS BI with Hadoop and Why to use Hadoop with SSAS

I'm reading: How to use MS BI with Hadoop and Why to use Hadoop with SSASTweet this !
IT Professionals who use DBMS, SQL, ETL, Reporting and/or Advanced Reporting, and Analytics consider this as the end of data ecosystems. But this is just mainstream IT sphere in the world of data. I do not intend to emphasize of the potential riding on Hadoop, as there are tons of reference material available for the same. If you want to quick check the direction of wind, you can simply fly a kite, you dont need a satellite weather report. Translating it into plain terms, if you want to get a hint of Hadoop's potential, just google on what data and analytics related companies are upto these days. You would find that database giants like TeraData, Microsoft, Informatica and others are ramping up big efforts to provide support for Hadoop. The big businesses that run on Hadoop are Facebook, Yahoo, LinkedIn, Twitter and others. This suffices to conclude that if you are a vetern opportunist in industry, Hadoop is one of the most promising targets.

The challenge of Hadoop starts with bringing it to mainstream IT, which is mostly warehousing data, reporting it and providing analytics. This methodology generally requires activites like data profiling, data cleansing, ETL, and creating warehouses / marts.

1) From the mainstream database world, Hadoop is a source as well as destination. Its more like a content management system functioning in the the form of a database. Hadoop is a MPP system that can run on parallel nodes reaping peta-byte scale data processing speeds. Cloud is one of the most appropriate infrastructure for the same. Windows Azure was already supporting Hadoop VM installations and now a new offering in underway which is known as Hadoop based services for Windows Azure.

2) Why to use Hadoop when we already have SSAS with the power of BISM ? Well any analytics professional would have this question. Theory does not wet the apetite of a practitioner, so the best answer is a case study video featuring how Klout leverages Hadoop and Microsoft BI Technologies to manage BIG Data.

3) Microsoft has announced a connector SQL Server Connector for Apache Hadoop, its a old news. But if you pay attention to detail it says its Sqoop based which is an open source tool provided by Cloudera which imports data from SQL Database into Hadoop Clusters. It can be a very nice to learn tool to start building your skill stakes in the Hadoop world. Any application would have to pump-in and pump-out data from Hadoop, so import export of data from SQL based databases to Hadoop is an inevitable process.

I plan to make MS BI, Analytics and Visual Business Intelligence coupled with BIG Data and cloud as my new regime. I would be sharing my experiences, thoughts and views on the way through my journey. I have introduced a new section on my blog titled Hadoop, BIG Data and Cloud and added a few useful links under the same. I would be adding more to this section, to keep a watch on the same.

In my views, a rolling stone gathers no moss. I intend to earn the same amount of money and respect and recognition I earn in a year, in a months time. I believe that if one has got a dream like this, one needs to be insightful and embrace the change, be a part of the change and make efforts to change the world thats not ready to change.

For my regular blog readers: My blog has remained silent for around 6 months, and my authoring presence has been going south. To my surprise from the blog statistics I was able to make out that the site visits have remained constant and at times have gone even high that it was ever, even without any activity on my blog. This gives me motivation to keep moving on and being an MVP I also feel an obligation on my shoulders to keep sharing my experiences. The reason for my low authoring activity have been my personal life, and I am turning on the lights of my blog after 6 months straight.

In the time that I took almost a break from blogging, two platforms that I have evidenced influencing the IT Industry limited to the scope of my perspective as a Solutions Architect for Business Intelligence and Analytics, are Android and Hadoop. I would discuss about Android at some other time, this post is about Hadoop.

Sunday, December 18, 2011

Difference between DirectQuery and In-memory mode in tabular mode analysis services

I'm reading: Difference between DirectQuery and In-memory mode in tabular mode analysis servicesTweet this !
Tabular models are one of the new enhancements coming in SQL Server 2012 especially with tabular mode analysis services. Querying data from these models is available in two modes: DirectQuery mode and In-memory mode. Those who are well versed with Multidimensional mode analysis services can grasp this very easily. DirectQuery mode is synonymous to ROLAP mode and In-memory mode is synonymous to MOLAP mode. DirectQuery reads data right from the relational data source while the in-memory mode queries data from the memory cache. Both has its own tradeoffs and benefits. More on the same can be read from here.

Interesting part about tabular models and these mode of queries is linked to a different fact. In SQL Server 2012 tabular mode analysis services, analysis services tabular projects can have just one model per solution. I find it a very serious limitation. But the data sources from where data can be sourced is immensely huge, and the list includes sources like Parallel Data Warehouse and ATOM feeds including SSRS reports too. This open up a huge range of interesting possibilities when these modes of querying data is linked with these data sources. For example, Parallel Data Warehouse can be linked to a tabular model, which in turn is used by an SSRS report as a source. Using DirectQuery mode, SSRS can fetch data from Parallel Data Warehouse in real time. This is one such example, but there are a huge range of interesting possibilities that these two modes can open up with interesting combinations of data sources. Check it out yourself.

Monday, October 03, 2011

Powerpivot and BISM in SQL Server Denali

I'm reading: Powerpivot and BISM in SQL Server DenaliTweet this !
Business Intelligence Semantic Model (BISM) is the new philosophy in MS BI analytics parlance, that is taking shape in SQL Server Denali. Tabular projects and MOLAP with choice of MDX or DAX can be termed as a brief definition of BISM, in tangible terms. SQL Server Denali CTP3 ships with all the new features supporting and reflecting BISM in SSAS. But that is just one part of the world.

Powerpivot is the flagship product of microsoft for self-service business intelligence. And surprisingly, microsoft is aggressively inducing the flavor of BISM here also. Three major additions to powerpivot are:

1) Diagram View: To me this looks more like a DSV equivalent of SSAS. Though I have not tried hands on, but from what it sounds, this is a very valued addition to the tool. End users would enjoy modeling using a designer, compared to an excel kind of UI for developing models.

2) Hierarchies: The ability to create user-defined hierarchies would mean that user can logically arrange and relate entities, which can translate the user can easily envision and model drill-down and rollups on their data. Hierarchies are so essential part of any data model, and this capability would enable users to logically analyze their data.

3) Perspectives: This is not a new feature, and those who have used SSAS would definitely understand what this means. If powerpivot data models are shared on a collaboration platform like Sharepoint, this feature can be a real value addition and abstract relevant part of the models to relevant users.

There is much more than just the above listed features, that is being offered in Powerpivot for Excel with SQL Server Denali. To learn about the same, check out this link.

Monday, July 11, 2011

MS BI Architecture Design Layers - classifying layer specific logic

I'm reading: MS BI Architecture Design Layers - classifying layer specific logicTweet this !
Any architecture design diagram is composed of several layers vertically and horizontally. Horizontal layers are discrete logical areas and their association in the diagram describes the way they are connected to each other. Vertical layers run across the entire solution and all these logical areas, which means they are applicable throughout the solution. For example, data repository can be classified as a horizontal layer and auditing can be classified as a vertical layer. This is a very well known fact and most of us would be knowing this very well.

When it comes to implementation, the association of these layers are honored and the solution is developed keeping this layers in view. But this is only in terms of how these layers are associated with each other, i.e. data and process would flow vertically and horizontally as defined in the architecture diagram. One very vital point that many miss is where to deploy your logic. Below are few logic deployment challenges or confusions that most of us would have faced as decision makers at some point of time in our careers:

1) Should logic be stored in .NET App or in DB Stored Procs

2) Should logic be stored in Stored Procs in OLTP DB or in ETL package

3) Should logic be stored in scheduled batch jobs or in ETL driver package

4) Should logic be stored in Stored Proc or SSRS Report

5) Should logic be stored in SSAS MDX Script or Client App

6) Should logic be stored in Dashboard or SSAS Cube

I have seen many genius taking their comfort route to make their jobs easy and jeopardize the future of the solution, just by deploying the logic that belongs to one layer of the architecture into another layer.

Once I had come across a scenario where one genius project manager tried to defend a solution with the argument that as the application was designed as a reporting application, entire logic is stored at the report level. This means SSRS RDLs contained the entire query logic and formatting logic within it. The solution in discussion was developed as a reporting application, and after few months down the line the requirement came up to act as a data source for other systems. As the logic was completely embedded in reports, it was not reusable at all and the solution design fell flat. Looking at embedded SQL in RDLs, any logical developer would ask, what an uncompiled SQL is doing in SSRS report ? SQL belongs to DB inside a SP and formatting the UI of the report is the report specific logic that can be contained in reports.

I have also been evident of scenarios where an application architect is in the driver seat, and the approach pursued it to embed entire logic into .NET code and treat DB as a blackbox to pump-in and pump-out data. In any corporate IT systems history you would find that application layer i.e. the User Interface / Web Front End layers are changed like changing the curtains of your windows, but corporate DB are hardly changed and whenever DBs are migrated they are a result of a large scale corporate IT systems revamping exercise.

I do not intend to hint that all logic should reside in the DB. Whatever logic that belongs to a particular architecture design layer, it should be deployed in that layer only, which is one of the implicit communication of layering in an architecture design diagram. Entire functionality can be achieved by deploying code in a single layer of the solution, but in the long term it would defeat the very purpose of layering and design patterns. Dissecting the right part of the logic in the right layer, followed by best practices of developing the layer would provide the most ideal solution from a stabilized solution design perspective.

In the field of technical architecture design, my career experience has been that each piece of logic should remain with it's deserving layer. Feel free to prove me wrong !!

Wednesday, May 18, 2011

Mobile Business Intelligence using SSRS in MS BI and impact on BISM

I'm reading: Mobile Business Intelligence using SSRS in MS BI and impact on BISMTweet this !
Mobile business intelligence is a growing need day by day, and with the advent of devices like Apple IPads and Samsung Galaxy Tabs, the requirement would continue to grow more and more. Long back when I was in my academics, we used to develop websites that would emit WML (Wireless Markup Language) over WAP (Wireless Application Protocol), which would be viewed on smart devices. We used to test these sites using Nokia mobile toolkit SDK. Time has changed drastically since then, and more android and symbian based thick clients as well as web based accelerator tools have emerged to cater mobile reporting needs. Mobile BI reporting is even more challenging, as this nature of reporting needs to be rich in visualizations as well as facilitate user interaction.


Blogosphere is celebrating the announcements made regarding SSAS and BISM, as the news are very positive and bright for SSAS and Vertipaq powered Powerpivot, but the set of reporting applications available as of now or on the horizon are still not that powerful. Crescent may be rich in visualizations (compared to SSRS), but not Mobile enabled to the best of my knowledge. SSRS, Powerpivot, Excel and Sharepoint Insights ( Excel Services, Visio Services, BCS, Performancepoint Services) - none of these can be made available for smart devices using any out-of-box features or technologies. The impact is that your BI solution is not mobile, and this can change the entire equation of technology selection. Just consider an example, that enterprises have online libraries for employees like Books24x7, and available over internet and even that is supported on smart devices. So if you plan to build a powerful BI and analytics application for an enterprise with maximum adoption and usability in view, with the tag of "NOT Mobile", how far one can expect the adoption and usability ?

Below is a list of a few prominent Mobile BI Vendors, but unfortunately SSRS / Microsoft is not on the list.

1) BIRT Mobile by Actuate

2) Roambi Enterprise Server (ES3) by MeLLmo

3) Microstrategy Mobile

4) PushBI by Extended Results

5) SAP BusinessObjects

6) QlikView for Mobile by QlikTech

7) SAS Mobile

8) SoftMaster Mobile Business Intelligence for Oracle Business Intelligence Enterprise Edition (OBIEE)

9) IBM Cognos 8 Go! Mobile for Cognos Business Intelligence

10) Other players such as LogiXML and Analyzer from Strategy Companion are emerging players.

Even I am happy with the announcements made by BISM, but still the weakness in reporting stack adds a concern, for which I do not see an out-of-box solution from MS BI Stack. The later Microsoft makes an entry into this area, the harder it would be to promote its adoption as clients would already had invested into other accelerators which are not Microsoft partners in this space. It's not a show stopper, but the results are obvious !! I am sure Microsoft must be having this in their vision, and if someone is reading this post from Microsoft, I would be glad to hear back their comments on this viewpoint of mine. Also please someone correct me if I am not updated in my knowhow on support for smart devices by reporting applications in Microsoft BI ecosystem.

Tuesday, May 10, 2011

Free SSAS tutorial : End to End, Step by Step with Exercise

I'm reading: Free SSAS tutorial : End to End, Step by Step with ExerciseTweet this !
SQL Server Analysis Services (SSAS) - This technology is considered one of the most challenging and most valued skills in the microsoft parlance. The reason for being challenging is the very nature of OLAP is multi dimensional. Professionals working on the database or administration side are used to think in two dimension i.e. rows and columns in tabular structures. SQL is designed for two dimensional structures. But as soon as you enter OLAP territory from OLTP territory, the first challenge for professionals from a relational background is to break the shackles of two dimensional thinking and empty your mind. You need to develop the state when you did not knew what a database meant.

Its not as easy to do as it is to state, but still its achievable. If you aspire to be a Business Intelligence professional, you need to start to add a different dimension to the way you think and analyze data. Dimensional Modeling, Cube Design, MDX, KPI, Dashboards, Analytical Charts, Graphs and Gauges, Self Service BI - this would be the landscape of your world in BI. It might sound very confusing and you might not even be knowing the meaning or full form of the abbreviations, but if you intend to make an entry into BI, you need to start with your baby steps somewhere.

Coming to the point, I have authored a complete end-to-end basic tutorial on SSAS and it can be read from here. What is so special in this tutorial that you should read it and not any other book that explains SSAS from scratch ? Very obvious question, and the answer is if you had any idea of what is SSAS and which book you should read, you would not be reading this post till here. If you are still reading this means that you either have an interest in learning SSAS as you are completely fresh to it, or you intend to refresh your fundamentals. Also if you are seasoned with SSAS feel free to review my draft and share your opinions. This tutorial is crafted from my experience of working with professionals who have made their migration from SQL Developer / DBA background to SSAS eventually. I am not claiming that its easy, but this tutorial can give you the launchpad to develop a vision of where you want to head on, which book you want to buy after understanding what is SSAS, whether SSAS interests you enough to make a migration to the BI world, etc. And final thing, its FREE.

I would like to invite you to take a glance at this tutorial, and I would be glad if it helped you in anyways. Feel free to share your opinions or comments by either dropping me an email or commenting on this post.

Wednesday, April 27, 2011

MS BI Infrastructure Architect - Developing readiness for the role and responsibilities

I'm reading: MS BI Infrastructure Architect - Developing readiness for the role and responsibilitiesTweet this !
Architect is a very appealing word to all the aspiring technical minds, but most people do not realize that architect is an adjective-free role. Have you ever heard terms like SSIS Architect, SSAS Architect, SSRS Architect, PPS Architect etc.. ? If yes, then I would say that Architect word has been loosely used instead of the term SME.

The first difference between developers and architects in my vision is the broadness of domain. Most developers would stick to a technology instead of a platform, whereas this ideology does not suit the JD for an architect. If you have the ideology that "I have worked with SQL Server for 5 - 8 yrs, I am good at T-SQL programming, SSIS, SSRS and have theoretical idea of DW. And if you ask me what is Sharepoint, .Net, Webservices, Cloud, Infrastructure, Data Modeling, etc.. this is not my domain.", I would stamp "Biased MS BI Developer" on your CV. Architect requires changing many hats like Technical Architect, Data Architect, Solution Architect etc, and being an Infrastructure Architect is one such hat. If you are an Architect, many a times you would find yourself in a role where you are the Infra Architect + Data Architect + Application Architect + Solution Architect, and you might be given few technology specific SMEs for consulting. I have been in such situations as I had experiences with all these individual roles as a tech lead through the course of my career. Whatever I am sharing is based on my experiences.

When a solution encompassing application development technologies and MS BI technologies are promoted from environment to environment i.e. from dev -> staging -> APT -> Prod, this requires infrastructure estimation, capacity planning, software configuration, server connection topology etc before the environments are built. If you think that to setup such environment, one can just procure servers, add memory and rig the systems, probably you must be setting up infrastructure for solutions of very modest size. If you are developing solutions for an enterprise class client, there is a high probability that there would be a Data Center with shared application environments where your solution would be hosted.

Here comes the first lesson as well as challenge for the Infra Architect. Virtualization is the SQL of Infrastructure capacity planning. You would have to deal with infrastructure teams, who would discuss, advise and challenge your estimations and talk about technologies like Hyper-V, VCPUs, RAM, Ports and Protocols. You might be using MS BI Stack, Sharepoint and .NET Stack, Microsoft System Center and each of these would have different connectivity and hardware requirements. At a minimum you should know what MS BI stack needs in terms of infrastructure design. Ideally in a virtualization environment, development servers run on 4 VCPU, 4 - 8 GB RAM and Production servers of modest size run on 8 VCPU and approx 16 GB RAM. If you are not aware of what is a core, vcpu, ports etc you should start developing an understanding of the same.

The next major challenge you would be faced with is memory capacity planning, this mostly depends upon data and load. Application Performance Testing environments would be setup to test performance, and you should learn how to interpret the results from those environments. Testing teams would be using Load Runner kind of tools to perform a load testing, and you would be getting regular reports containing performance counters, concurrent users, memory utilization, CPU utilization etc. This is second area where would act as your profiler.

The final major challenge is allocation right amount of memory for different aspects of the solution. For example, if you have SQL Server and MS BI technologies, you need to allocate memory for logs, backups, installation, data etc. Based on this calculation you need to estimate total memory requirements and also setup designs for hosting application environments on the planned infrastructure.

You would not be practically building servers and installing softwares. In an enterprise class IT environment, there are dedicated teams for the same, but the order to march forward comes from the architect of the solution and not the architect of infrastructure teams. So at the minimum you have to create a technical architecture diagrams from infra setup to communicate your design and estimation. Being in such a role is a challenge, and fortunately or unfortunately I have been in such role and had learned a lot from the same. I hope this post brings some vision to professionals prone to such challenges. If you need to borrow my experience, feel free to drop me an email.

Saturday, April 02, 2011

Load testing / Performance testing SSAS for evaluating scalability

I'm reading: Load testing / Performance testing SSAS for evaluating scalabilityTweet this !
APT (Application Performance Testing) is one of the standard environments, among the different environments that are set up in any typical SDLC. Results from APT environment are considered as direct indicator of the capability of any solution to scale. Load Runner is one of the most successful and widely used tools in this environment. Use cases are provided to testing teams, steps for each use case are executed and scripts are recorded, and the same scenario is repeated for a targeted number of users. This creates a simulation of a predefined number of users accessing the solution concurrently using most probably use case scenarios. The results from these tests provide direct insight into scalability, concurrency and other aspects of the solution.

Load Runner though a very useful tool, is more suited to be used by testing professionals. And it's also not a free tool. It's always good to have some load simulators in the hands of developers to load test their development artifacts, so that they can figure out the probable bottleneck areas even before the solution reaches APT environment. Again it's better if such tool is a part of the development IDE itself or if it's a freeware, as business stakeholders won't entertain a separate licensed tool for developers. One such tool of the same flavor for SSAS has newly made entry on Codeplex, and it's known as AS Performance Workbench. It can be seen as a micro version of load runner, but if the tool provides what it claims on the project home page, it would be a brilliant tool to have. I would be more happy if this tool is fused with BIDSHelper. I suggest to download and checkout this tool, and you might find another nuke to store in your arsenal of developer tools.

Sunday, March 20, 2011

Use of visualizations for analyzing multi-dimensional data

I'm reading: Use of visualizations for analyzing multi-dimensional dataTweet this !
Visualizations are a very powerful ways of representing complex data. The visualizations that you should choose depends on the kind of data you want to represent and kind of analysis that you want to facilitate on the top of this data. There are a few heavily used visualizations for data analysis, and below is a brief list of the visualizations that I admire the most for analytical data representation.

1) Box plot / Scatter plot charts - These charts are mostly used for outliers analysis.

2) Candlestick charts - For analyzing extremely volatile data like movement of a particular stock during the day, with associated values like high-low-open-close.

3) Line charts / Range charts: For displaying multiple trends on the same graph for trend analysis and correlation analysis.

4) Tree map / Performance map: For portfolio analysis and measuring weighted values of each item within a portfolio.

5) Decomposition Trees: For problem decomposition using drill-down and drill-through techniques in the same visualization.

Tuesday, February 08, 2011

SSRS 2005 to SSRS 2008 R2 Migration Strategy , SSIS 2005 to SSIS 2008 R2 Migration Strategy, SSAS 2005 to SSAS 2008 R2 Migration Strategy

I'm reading: SSRS 2005 to SSRS 2008 R2 Migration Strategy , SSIS 2005 to SSIS 2008 R2 Migration Strategy, SSAS 2005 to SSAS 2008 R2 Migration StrategyTweet this !
Product edition upgrade and migration of solution artifacts from lower to higher edition is quite a challenge and needs careful planning. The more experience you have on different migrations, the more you would have anticipation of possible problems for migration. However deep may be one's experience, data and platform migration is one such area where one can always expect surprises. Everyone has a first time, and in migration you would want to be sure that you have all the supporting tools and some higher level strategy in mind to design your migration. Below are some guidelines which I had found useful in my career experiences.

1) Firstly collect all the tools, at least freewares that can help you in your migration analysis. SQL Server 2008 R2 ships with SQL Server Upgrade Advisor, which can be the best starting point. This tool is also a part of the SQL Server 2008 R2 Features Pack. You can learn more about the same from
here. This tool covers all areas, right from database engine till SSAS.

2) When you start your design, you would have to make a clear distinction between whether you want to perform an in-place upgrade or create a new instance -> deploy solution on the new instance -> ensure synchronization between old and new instance -> abandon old instance. Check out this
article for some more info.

3) You should keep in view where you plan to do the upgrade, i.e. on the same box, in the same domain, or across different servers and different domains. This would throw up the challenge of security configuration.

4) Environment configuration needs to be planned for each service separately. For example, SSIS packages can be expected to use configuration settings from different sources like environment variables, configuration files, database and other sources. SSRS configuration might reside in config files for reports server as well as reports manager. Virtualization is the key factor is testing all such scenarios.

5) Finally the biggest risk factor needs to be calculated, i.e. identifying the right sampling to test on the targeted edition. SQL Server 2005 came with it's first mature BI offering. Several components of different services have undergone architectural changes, several features are discontinued, several features have behavioral changes and several features are guaranteed to break when migrating from lower to higher editions.

a)
Deprecated Features in SQL Server Reporting Services
b) Discontinued Functionality in SQL Server Reporting Services
c) Breaking Changes in SQL Server Reporting Services
d) Behavior Changes in SQL Server Reporting Services

I prefer creating out a consolidated list of these features. Then all the reports should be analysed to check if any reports have used these features, which would mean that these reports qualify to be considered as a sample to test on the targeted edition. This sampling exercise would not only generate right size of samples to test, but also the same sample would act as the Acceptance Testing Procedure.

Generally production environments are handled by operations team, and they remain in charge of migration too. Development teams need to confirm whether migration was successful and works as expected. The successful functioning of sampling identified from the above exercise would act as the Acceptance Testing routine, which is a contract that needs to be agreed between development and operations team in advance before migration is performed. Keep in view, that this exercise needs to be performed for each service individually - DB Engine, SSIS, SSAS and SSRS.

It's a very brief list, but these points can at least help you align your strategy in some direction when you are totally blank on how you would plan your migration. If you have better tips that can add value to this post, please feel free to share your comments.

Tuesday, January 18, 2011

Self Service Dashboard Development using Analyzer as Reporting Solution

I'm reading: Self Service Dashboard Development using Analyzer as Reporting SolutionTweet this !
I have been engaged by Strategy Companion to conduct an open and unbiased exploration of their reporting solution - Analyzer, which is mainly targeted to facilitate reporting from cubes built using SQL Server Analysis Services. Also they have generously provided me an opportunity to share a few BI recipes, which I have experimented with using Analyzer. I started exploring Analyzer, and the first thing that I observed about Analyzer is that it's designed for business users, giving them the same or even more weight than technical users.

Self-service BI

Self-service BI is a buzzword and sales folks generally use it as one of their Unique Selling Propositions (USPs) to market their solutions. In my view there is a difference between self-service BI and managed self-service BI. Easy authoring and controlled utilization are two of the very important factors for a self-service BI solution. If the authoring environment is not easily adaptable, there is a great chance that your solution would not get utilized at all. If utilization is not controlled there would be an explosive and unorganized utilization, as the report users would treat the reporting solution as a lab to experiment with reports in a free-flow manner. In simple language, considering a reporting solution like Analyzer, the report authoring environment should be easy enough such that business users can create their dashboards with ease. Also user and role based security should be available, so that report authoring and utilization can be managed. In this article, I intend to share the report authoring experience.

Before one makes a decision about using a product, any CEO / CIO / SVP / Analyst would want to check out certain fundamental level details about the product, which generally falls into two categories: Capital Expenditure (CAPEX) and Operational Expenditure (OPEX). Let's glide through such details in brief.

Licensing (CAPEX): Analyzer comes in different licensing flavors, and the major classifications are:

Enterprise - This is for internal corporate BI applications.

OEM - Use this edition if you intend to integrate Analyzer into your own application by using the features of this solution as a web service.

SaaS - In cases where you intend to exploit the benefits of offering a reporting solution on your own cloud based platform, give a try to this edition.This version is used by companies who are hosting BI in their own cloud and (usually) charging their customers for access to a set of pre-built reports and dashboards and the data they contain, along with the ability to interact with that data.

Deployment (OPEX): Analyzer is a zero-footprint installation. This is generally a confused term with many professionals, so I would elaborate on this a bit. Analyzer can be installed on a central BI / DB server which has IIS installed on it. Or the IIS machine can be a separate machine from the BI / DB server. Analyzer needs to be installed on an IIS server (one or more) as this solution is developed using .NET and DHTML, and it also needs access to a SQL Server 2005 / 2008 / R2 database engine as it creates a database to use for its internal functioning such as metadata storage. Workstations can connect to Analyzer using just a browser which means that you do not need to install anything on client machines except a browser. This is true no matter what role the user has, such as Admin, Report Designer, or End User.

Now let's focus on the beginner level recipe to create a dashboard using Analyzer. I call this recipe as "Zero to Dashboard in 60 Minutes".

Scenario: A Sales head of a company needs to create a quick last minute dashboard to present at the quarterly board meeting. Company has a cube that is created using SSAS, and for the sake of this demo we would be using the cube created using AdventureWorks SSAS project that ships with SQL Server.

Hardware Setup: Most companies have contracts with hardware maintenance vendors, and in such environment end-user terminals are equipped with only the necessary amount of hardware required as contracts can be pay-per-use. I intentionally used a machine with 1 GB RAM, 60 GB free hard disk space, and 1.77 GHz Intel processor. This is a typical configuration of any low end laptop that should be sufficient to folks who just need to use MS Office and Outlook on their machines.

Requirements: The target audience of the dashboard is the senior management of an organization, and the Sales Head is authoring the report. Such dashboard / report can be expected to contain a few of the commonly used constituents of a dashboard.

1) A ScoreCard containing KPIs, which can be hosted in the cube
2) Strategy Map showing at least some basic kind of process flow
3) Geospatial Reporting, which is one of the best presentation forms for a senior level business audience
4) Matrix Reporting, for a detailed level study of aggregated figures
5) Filters, which are necessary to analyze the details in isolated scopes
6) Drill-Down functionality, as problems decomposition and study is carried out in a hierarchical manner.

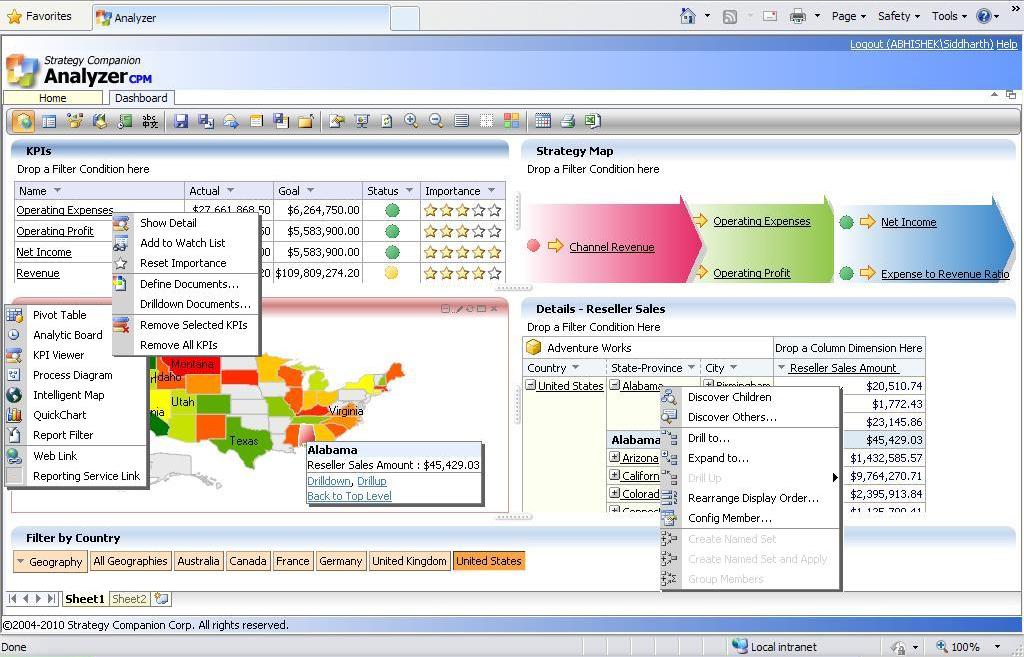
Report Authoring: I had Analyzer and the AdventureWorks cube on the same machine. Once you start Analyzer and create a new report, you would find the interface as visible in the below screenshot. To author the report, entire functionality is available on the toolbar or from context-sensitive menus. Plotting data on controls is a matter of drag-and-drop from the data tab visible on the left side.

Click to enlarge image For all the points described above in the requirements section, out-of-box controls are available.

1) KPI Viewer - This control be used for creating a scorecard hosting KPIs. Also you would find some very interesting columns like "Importance" out-of-box which can be quite an effort to create in PerformancePoint Services.

2) Process Diagram - This control can be used to create a basic level strategy map. Though this strategy map is not as appealing as a Strategy Map created out of a data-driven diagram in Visio, but still its fine enough for a last minute dashboard. Also it can host my KPIs there too.

3) Intelligent Map - This can be considered synonymous to what Bing Maps control is to SSRS. It's completely configurable and contains wide variety of maps ranging from World Map to area-specific maps.

4) Pivot Table - This control is perfectly suitable for OLAP reporting in a grid based UI.

5) Filters - Report filter have a very different UI, than traditional UI of a drop-down. Though it occupies more real-estate of screen space, it makes the report more appealing, so it's worth it. Considering the present scope of this report, I chose to place the filters at the bottom of the page, instead of placing it at the top.

You can see at the bottom of these screenshots that each report or dashboard in Analyzer can contain multiple sheets (no limit) each of which can contain its own combination of controls such as pivot tables, maps, charts, etc. In this example we are only using one sheet.

Click to enlarge imageCheck out the context menus of all these different controls, and you can see what different options are available with each control. On selecting "Discover Children" at "Alabama" level in pivot table, a different sheet opens up with this wonderful report and UI, as shown in the below screenshot.

Click to enlarge image
Summary: With out-of-the-box controls, drag-and-drop functionality, a very decent looking report can be created in less than 60 minutes, to target the senior most audience of an organization who expect a report that supports decision making with its analytical capabilities. Provided your cube is ready with all the data structures like KPIs, Named Sets, Hierarchies, Measures, etc., reporting is almost taken care of if Analyzer is available at your disposal. A phrase that suits the summary is "Keep your ducks in a row" i.e. have your cube in proper shape to support your reporting, and then using Analyzer, below is the result that I was able to achieve in less than an hour, with very little experience using Analyzer beforehand. A more experienced Analyzer user could no doubt build this kind of report even faster.


Click to enlarge image

Wednesday, December 29, 2010

SSAS Engine , SSIS Engine and SSRS Engine

I'm reading: SSAS Engine , SSIS Engine and SSRS EngineTweet this !
Speaking about Microsoft Business Intelligence stack i.e. SSIS / SSAS / SSRS, there are different engines associated with each services. If you are ignorant about these engines, you probably are not fit to design the architecture of your solution using the respective services. The major engines that comes into consideration when you are using MS BI stack are as below:

1) SSIS Runtime Engine - This engine takes care of the administration and execution section of SSIS. In a developer language, I would consider it a Control Flow + SSMS of SSIS.

2) SSIS Data Flow Engine - This engine can be considered as the Buffer Manager of SSIS in-memory architecture.

3) SSAS Formula Engine - The engine takes care of resolving the retrieval of members on any axis of an MDX query. Tuning the performance of this engine has much to do with MDX tuning.

4) SSAS Storage Engine - This engine can be considered as the Data Manager of SSAS, which decides what data needs to be fetched from where. If you trouble Formula Engine, there is a good possibility that this would cascade to Storage Engine, which directly deals with aggregations.

5) SSRS Service Endpoint - This cannot be technically considered as an engine, as most people would argue that rendering / authentication / processing are engines, but I consider these as extensions rather than engines. This endpoint takes care of the administration part of SSRS. Anything that you can do with Reports Manager is a virtue of this endpoint.

6) SSRS Execution Endpoint - This is the endpoint that one would like to award the medal of being an engine. This endpoint takes care of executing the report right from processing the RDL till rendering the report.

You can read more about each of these in MSDN as well as different books and blogs. But until you thoroughly understand the function of these engines and you are designing the architecture, I am of the opinion that one should not feel confident about the architecture design.

Monday, December 20, 2010

Tool to create / support BUS architecture based data warehouse design

I'm reading: Tool to create / support BUS architecture based data warehouse designTweet this !
Whatsoever powerful SSAS may be, when it comes to starting a fresh new dimensional modeling exercise, using SSAS is the last step in the process i.e. data warehouse implementation. Dimensional modeling starts with the understanding of how the clients want to analyse their business, which implicitly involves identifying the ER of the targeted business models. Right from there, one needs to develop a BUS matrix (provided you are following kimball methodology and BUS architecture) followed by a Data Map / Data Dictionary.

Once you have the blue-print ready, artifacts required to build the anatomy of the data warehouse needs to be built, and two of the major ones are:
1) ETL routines to shape your data compliant to Data Mart design.
2) Relational Data warehouse / Data Mart i.e. dimension and fact tables and other database objects that would hold your data transformed by ETL.

The process sounds quite crystal clear, but when you are developing from scratch, and when your data warehouse and dimensional modeling is in the phase of evolution, there is one tool which can be very instrumental in designing the same. The wonderful part is that this tool / template comes for free from the courtesy of kimball group, and it's called Dimensional Modeling Spreadsheet.

Dimensional Modeling Spreadsheet: This template spreadsheet can help you to create your entire data dictionary / data map for your dimensional model, and it contains samples for some of the basic dimensions used in almost any dimensional model. The unique thing about this spreadsheet is that once you have keyed in your design, it has the option to create SQL out of your model. You can use this SQL Script in your database and create the dimension and fact tables right out of it, which means that your data mart / relational data warehouse is ready to store the data. Also this spreadsheet can form the base for your ETL routines. The only other tool in my knowledge which can serve near to this functionality is Wherescape RED, and of course it's not free, as it serves a lot more than just this.

You can read more about this spreadsheet in the book "The Microsoft Data Warehouse Toolkit: With SQL Server 2005 and the Microsoft Business Intelligence Toolset". For those who are fresh to dimensional modeling concepts, read this
article to gain a basic idea of the life-cycle.

Wednesday, December 08, 2010

Achieve high availability of cubes using SSAS and SSIS

I'm reading: Achieve high availability of cubes using SSAS and SSISTweet this !
Recently, I was faced with two different questions at two different events and both of questions were directly or indirectly linked to high availability of cubes for querying. Those two questions were:

1) What is the difference between scale out and scale up?
2) How would use ensure 24 x 7 availability of a cube, considering the point that globally users are accessing the cube, and the cube should always remain available for querying?

The answer to the first question is when you need to achieve parallelism for concurrency in querying or processing, you distribute / replicate processing operations and/or data on multiple nodes. Scale up usually means that you increase the capacity of the host to enable the server to cater the incoming load. When the capacities of scaling up ends, scaling out steps in.

The next question was quite interesting, and the challenge was that I was in a situation to instantly think of a design and answer this query. I answered this question correctly, and to my delight, I found this whitepaper which is exactly what I answered. Such moments bring a lot of happiness and confidence that my knowledge has not gone stale and I can continue to provide consulting in MS BI business.

The presentation layer is coupled with SSAS query server. Data is read from relational engine and cube is processed on a separate server, which can be considered another layer altogether. After the cube is processed, query server and processing server are synchronized. For multi-server synchronization, SSIS is used. The below two diagrams demonstrates the same. Entire whitepaper can be read from
here.


Thursday, December 02, 2010

Limitations / Disadvantages of using Calculated Measures / Calculated Members in SSAS

I'm reading: Limitations / Disadvantages of using Calculated Measures / Calculated Members in SSASTweet this !
In my views, Designing is a process that is driven entirely by impact analysis. However trivial a product / tool / technology feature may be, if it's used without thoroughly analyzing the impact it can have on the overall system / solution that has to be developed, this would mean that you just signed up a guaranteed future roadblock.

Calculated measures / members seem like a very straightforward design feature, and whenever you feel need / shortage of some members / measures, calculated ones seems to be a very easily available option from a development perspective. But there is another side of the same, and these points should be kept in consideration before you make the decision of going with calculated members / measures.

1) Drillthrough does not operate on calculated measures or any other calculations that reference calculated measures / calculated members. This means, for example, if you have created a calculated measure on the cube which the user might opt to use as a part of drillthrough dataset, this means that now you are stuck and you need to find a workaround.

2) Calculated measures cannot be secured using Dimension Security in a straight forward manner, in fact they won't be listed at all in the Dimension tab of the role where we define the Dimension security. Also when security is applied on regular members, and due to the same, if they are not available to calculated members, they would fail i.e. when such measures are browsed in client tools like Excel, the value that would be displayed is an error value like #VALUE.

Based on the above two points, calculated measures / members should be scanned against drillthrough and security requirements, so that a trivial overlook in design doesn't translate into a showstopper issue over the period of time at a later stage.

Monday, November 29, 2010

SSAS Interview Questions / SSAS Training Curriculum

I'm reading: SSAS Interview Questions / SSAS Training CurriculumTweet this !
Whenever one wants to learn something or make sure one is competent enough to take the helm of any challenge in a particular technology, the first thing one needs to know is what one should be knowing. In simple words one should be aware of the topics that one needs to cover, then the next point is how much ground has already been covered and how much is yet to be covered. Below is a list of roughly drafted high level areas of SSAS in no particular order, which can be considered as a descent coverage, whether it's considered for SSAS training / SSAS interview. Keep in view that though the below coverage covers a major ground, it's not exhaustive and it can be used as a reference check to make sure you cover enough in your trainings / to make sure you have covered major fundamental areas.

  • Types of Dimensions
  • Types of Measures
  • Types of relationships between dimensions and measuregroups: None (IgnoreUnrelatedDimensions), Fact, Regular, Reference, Many to Many, Data Mining
  • Star Vs Snowflake schema and Dimensional modeling
  • Data storage modes - MOLAP, ROLAP, HOLAP
  • MDX Query syntax
  • Functions used commonly in MDX like Filter, Descendants, BAsc and others
  • Difference between EXISTS AND EXISTING, NON EMPTY keyword and function, NON_EMPTY_BEHAVIOR, ParallelPeriod, AUTOEXISTS
  • Difference between static and dynamic set
  • Difference between natural and unnatural hierarchy, attribute relationships
  • Difference between rigid and flexible relationships
  • Difference between attirubte hierarchy and user hierarchy
  • Dimension, Hierarchy, Level, and Members
  • Difference between database dimension and cube dimension
  • Importance of CALCULATE keyword in MDX script, data pass and limiting cube space
  • Effect of materialize
  • Partition processing and Aggregation Usage Wizard
  • Perspectives, Translations, Linked Object Wizard
  • Handling late arriving dimensions / early arriving facts
  • Proactive caching, Lazy aggregations
  • Partition processing options
  • Role playing Dimensions, Junk Dimensions, Conformed Dimensions, SCD and other types of dimensions
  • Parent Child Hierarchy, NamingTemplate property, MemberWithLeafLevelData property
  • Cube performance, MDX performance
  • How to pass parameter in MDX
  • SSAS 2005 vs SSAS 2008
  • Dimension security vs Cell security
  • SCOPE statement, THIS keyword, SUBCUBE
  • CASE (CASE, WHEN, THEN, ELSE, END) statement, IF THEN END IF, IS keyword, HAVING clause
  • CELL CALCULATION and CONDITION clause
  • RECURSION and FREEZE statement
  • Common types of errors encountered while processing a dimension / measure groups / cube
  • Logging and monitoring MDX scripts and cube performance
Related Posts with Thumbnails